

A: Answer by Henry; a technical analysis expert.
1 min, 5 min or 10 min chart makes really makes little difference. What you read about noise on 1 min chart is not true. The issue is about what settings you have on your indicator for any particular time frame. If you use a macd with a 26 period setting you will get a lot more trades than if you set it with 60 period. The 60 period will keep you in a slow rising long trend for longer compared to the 26 period setting. On a fast rising short trend with a pull back the 26 will give you a profit while the 60 period will give you a loss. That applies to any time frame. On slow rising trend days a 1 min chart may give a profit on a larger period indicator setting while a 5 or 10 min chart will give no profit.
Likewise with multiple indicators. A macd + RSI will give you a higher probability of a win but the wins will be smaller than the lower probability wins if you use macd without RSI. As win rate goes up, win points goes down. The bottom line is that nothing works all the time and most things balance out over the long term to about 50/50.
What makes the real difference is four fold. I would say in the following order. Having correct money management, having the psychological ability to ride out the loosing periods of several trades, having the discipline to stick to the strategy and having a strategy where winners are run larger than the losers. Imo the time frame and what indicator to use are of relative little importance other than the greater the time frame, the greater the drawdown on losing trades - which is another psychological issue.
A: Relative strength can get to be a bit of confusing area, I think what you're asking about is Relative Strength measured against an index and/or price measured against itself (Absolute Strength Sharelock calls is) as opposed to RSI which is generally Welles Wilder RSI and is a momentum indicator. Sharescope will chart Relative Strength against an index, Sharelock will provide percentage figures over a given timeframe for both Relative Strength and Absolute Strength so you can screen for stocks on this basis using your own custom screen.
Answer by Henry; a technical analysis expert.
You can do comparisons on say, ADVFN.com charts for a visual on Relative Strength. If you go to charts and select the epic LSE:OXIG it will bring up the basic chart. You now need to consider the period of time you want to compare against. So suppose you wanted to check relative strength over two years between OXIG and its index which is the Mid250 (LSE:MIDD). In the right hand window above the chart select 'overlays' and type in LSE:MIDD and re click 'Draw' [plotted 2 years on a daily basis period]. Now select 'Studies' and scroll and click Relative Strength Index from the first Select Studies option. You should now have a chart like this:
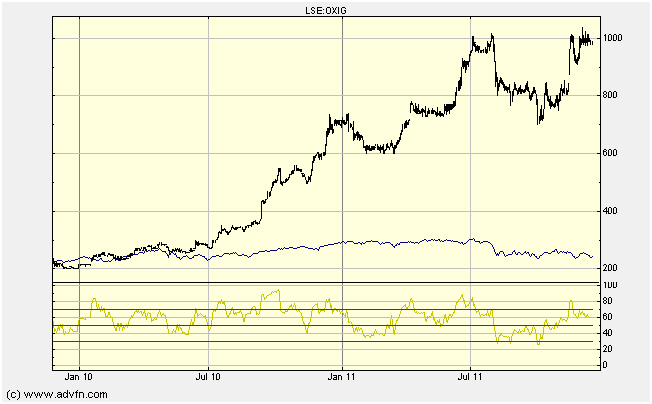 |
You can see from this chart that the RSI chart in the bottom window is of no value to you as explained above. What is of value is that you get a visual of just how much stronger OXIG is than the MIDD index. Stocks that perform strongly tend to continue performing strongly. Now delete the OXIG epic and replace with IPF and you should get this chart:
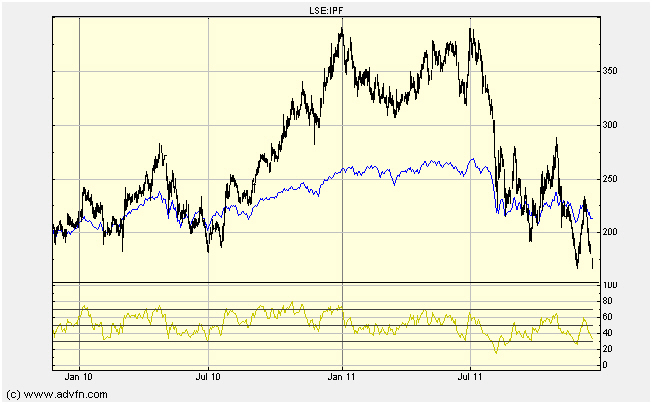 |
You can see from this that the stock was out performing the index last year but has recently dropped to under perform the index. You can add additional overlays for other index, sectors or companies.
A: The indicators you mention will give you around a 50/50 hit rate. Your system seems very dependent on moving averages - why do feel they are so important seeing that you have already established the trend before referring to the moving averages? In my opinion this is where the 'human eye' approach can never be bettered by mechanical/rule based systems. How about, once you have established the trend, you manually calculate what constitutes 'an average pull back within that trend' by manually assessing the pull backs which occurred before it? Some people might use fibonacci for this.
Another idea is to look for 'areas' of price action which you can mark up as important. Historically markets 'react' time and time again at the same areas. Using volume studies can help here as well. These areas simply constitute points which you could use to set up entry points and indeed exits out of the market. The idea being that you know very quickly if you are in a bad trade. So, for instance, suppose instrument ABC is in a consolidation after a short uptrend. Your chart shows you that $38.50 was good support on the way down 6 months ago but finally gave way causing the market to fall lower. The chances are that you will find that the same price will cause 'a reaction' on the way up. This presents you with an opportunity. If you place your trade near to $38.50 (long or short) you will know pretty quickly if the trade is a good one. The key in this game is to keep losses small. You'll be surprised in this game how one or two decent trades will make up for 10 small losses provided you accept that you will be wrong more than you are right and hence will develop a 'hard nosed' approach for cutting those bad trades more quickly. Money management aside; most people who fail in trading do so because they have an insane ability to run losses whilst cutting winners. In fact, surprisingly if you were to sit in front of a screen showing two winners and two losers, most people would cut the winners first and hang onto the losing trades in the hope that the losses would turn around. People also keep larger than needed stops because they feel that it will keep them in positions longer - they want 'bang for their buck' so to speak. People also place stops and just let them get hit despite the fact that they see price action that negates the original basis of their trade.
Also, remember that some indicators won't work some of the time on the same market and others which work in this market may fail in different market conditions. Whatever you choose has to work consistently and you need to follow your system meticulously, otherwise you will only get random results. And keep in mind that no two people will see / interpret a chart in the exactly the same way. You can try, say 4 or 5 indicators and when you get confirmation with 4 out of 5 or 3 out of 4 you could try the trade. Be consistent. Understanding the workings of moving averages implies recognising their limitations and help you identify false moves. At the end of the day there is no get rich quick scheme, it is all a learning curve that will hopefully one day end in riches!
To conclude, the problems with most indicators (for instance moving averages and relative strength index) is that they don't have an edge and only look to work in hindsight once you have adjusted the length or the timeframe to tune into the indicator in question. By that time everybody sees the same thing and low and behold those settings don't work anymore. Much of this 'need for indicators' is psychological. Human nature being what it is makes us come into the markets with certain beliefs and fears. Just like when we learn to swim we look to grab onto arm bands and bits of foam which we 'believe' will help keep us keep afloat and aid our swimming. Your search for a blend of indicators is indicative of the same 'self preservation' belief structures but the best research you can do is to study your own trading mistakes!
The content of this site is copyright 2016 Financial Spread Betting Ltd. Please contact us if you wish to reproduce any of it.