Choosing a Strategy that’s Right for You
Now we come to the heart of the matter – how do we develop a methodology or trading strategy that, if repeated in every trade situation, will result in having more winners than losers (in money terms)?
The point of any trading strategy is to form a methodology that can help you identify when to buy (go long or cover shorts), and when to sell (to short or liquidate longs). We can use Elliott Wave principles and Fibonacci analysis as the basis of our trading strategy, as they are deterministic, and not subjective.
Because you have your own personality, what will work for you may well not work for someone else. It is important to make that point. There is not a one-size-fits-all strategy that works for everyone. Most of the trading systems I have seen on the market do not take this into account, and assume we are all the same personality.
I believe one of the main reasons many beginning traders fail is because they have started off not even considering what type of strategy fits into their personality. Now, with this book, every trader should be able to assess his/her strengths and weaknesses and pick the right one.
There are two main trading strategies to choose from (with many variations within each). The first is Trading With The Trend, and the other is Trading For Reversals (Trend changes). Both have their strengths and weaknesses, depending on the market conditions at the time. If you are a relative novice doing your own analysis, the safest one to begin with is to choose is the first – Trading With The Trend.
Let’s explore some of the options.
Because spread betting lends itself perfectly to technical analysis, we shall look at this in some detail.
I will assume you know what a chart looks like in many time-frames. Most spread betting platforms can give you real-time charts with bars from 1 minute to 1 month. I like to use candlestick charts, rather than bar charts. A candle represents each period of trading. The top and the bottom are the period’s high and low, and the wide part shows the range of the closing and the opening price. If the close is higher than the open, the bar is coloured green. If the open is higher than the close, the bar is red (may differ with other platforms).
There are many subtleties with candlesticks, and if you are interested, there are many sources readily available to study them. The methods I describe will use just the simple time chart – it just looks prettier than a bar chart! And it works.
The Basics Of Technical Analysis
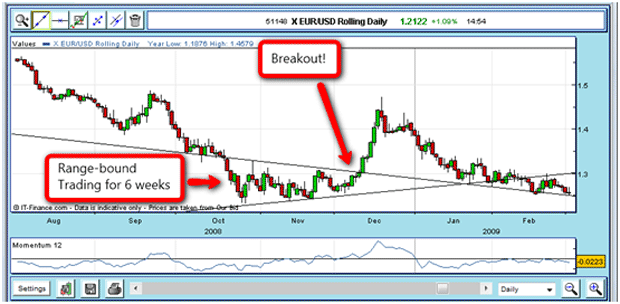
If you look at a large number of charts, you will notice that very often, prices stay stuck in a range bounded by a high and a low. You can draw roughly straight lines at the upper and the lower limits:

As a trader, I’m sure you can spot a possible trading opportunity – sell when the market gets to the top and buy when it gets to the bottom. It looks so simple. But we know that this situation doesn’t last for ever, and eventually, we will get caught out when it breaks out of the trading range (called a ‘breakout’). My personal style tells me I should go long on a stop-buy order on this breakout – and what a huge move that was!
When a market trades in a range for a while, the pressure builds as more and more trading positions are put on. If the breakout is upwards, the shorts will be hurting and will be buying back their positions to restrict their losses. If the breakout is downwards, the longs will be hurting and will be selling out.
The longer the market stays within these ‘congestion zones’, the stronger the break-out, as a general rule. Have a look at some charts and see if you can spot the strong breakouts.
That is why, most of the time, a breakout from a range is normally a good place to jump on board with your stop-entry order and ride the move. A word of warning – sometimes, we get a ‘false’ breakout, where the market just turns back an goes the other way. This is very common in short time-frames, less so on the daily and weekly charts.
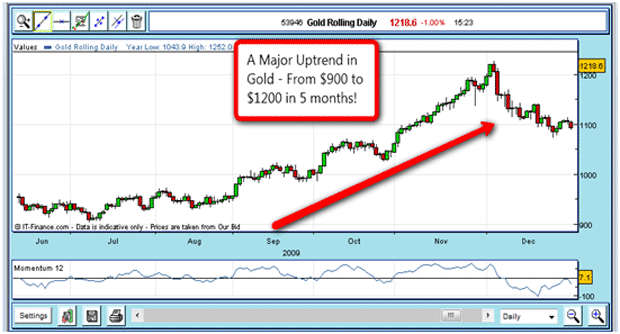
Then, if we get a breakout, markets most often move steadily in one direction, creating a trend with small counter-trend moves. A good example is Gold in 2009:

You can see the market is in a clear uptrend (higher lows and higher highs as time progresses). An old saying in the markets is: ‘The trend is your friend’, and in trending markets, it certainly is.
A remarkable feature of many uptrending markets is that you can take a ruler to the low points and draw a straight line which touches at several points! Who said nature doesn’t have any straight lines? It’s as if there is an invisible wall preventing the market from pushing through (until it does!).
But in the Gold example, the trend is exponential – a sign of a ‘bubble’ market.
So you can see our first trading strategy: trade with the trend.


Join the discussion