How To Apply Elliott Wave Theory
I must warn you though, that a deep study of Elliott Wave principles can take many years – even a lifetime. But for our purposes, all we need are a few basic concepts which can be used in surprisingly frequent situations – which is lucky for us.
When you become familiar with these, you will see what is possible on the charts at a glance. I remember when I started using them, and I was constantly amazed at what I saw – I found it hard to believe! It was like having a crystal ball – the markets would eerily follow the path I had forecast! I sincerely hope the same will happen to you.
The first thing to notice on any chart is that wave patterns appear in many time-frames. In fact, if you look at a monthly chart and then a 5-minute chart, you will see the very same patterns. If you removed the labels, you will not be able to tell the difference!
This means that Elliott Wave theory can be applied to any time-frame. This is incredibly useful information. You will see waves within waves within waves, etc. This is what makes the theory powerful, yet so difficult to interpret much of the time.
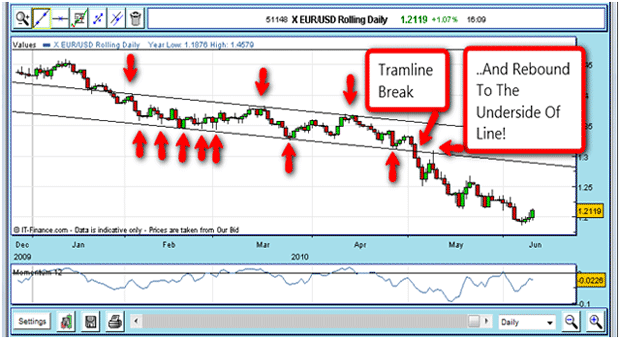
We have seen that a glance at any chart will show that markets move in waves – some up, and some down. When a market is trending up (defined by higher highs and higher lows), we can often draw straight lines passing through the lows and a parallel line drawn through the highs, making a pair of ‘tram lines’. Here is a good example – note that once inside the tramlines, the market bounced off them a total of 10 times!
Then, when the market finally punched through to the downside, the market was attracted to the underside of the line, and then was rejected like a scalded cat. This is typical behaviour and we can use this knowledge to place orders.

Know Your A-B-Cs
Elliott made the observation that when markets are in a strong trend, the whole move takes place in 5 waves – 3 waves in the direction of the trend (Waves 1,3, and 5), and 2 waves counter-trend (Waves 2 and 4). Also, the two counter-trend waves very often has a 3-wave structure within (the waves called A, B, and C).
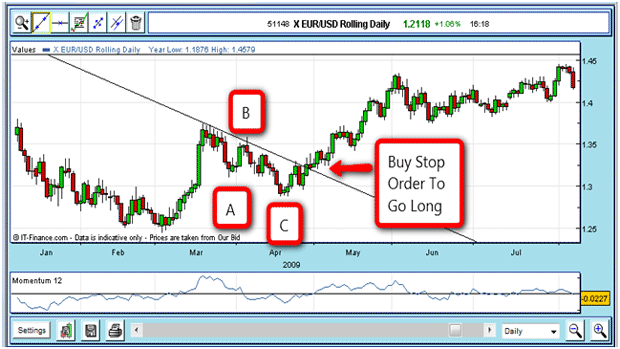
One of the give-aways telling the direction of the trend is to spot a clear 3-wave counter-trend move. If you are following a trend-following strategy, you can trade near the low of Wave C, expecting that wave to be the low of the counter-trend move in anticipation of the trend resuming. Tight stops can be employed with confidence. Here is a good example:
In mid-February, the market has found a low and is rallying but runs into trouble. The correction in March shows a clear A-B-C wave structure, with Momentum falling back from the severe overbought readings mid-month.
There is also a very clear downtrend line that is breached in an upside breakout at the end of April. Placing your buy-stop to enter here would have worked out well.

If you are new to Elliott, I encourage you to examine lots of charts and try to spot the 5-wave motive moves, and the 3-wave counter-trend moves (retracements). With practice, looking at charts in this way will become second nature to you. Then, market action stops looking random, and starts making sense. You will then be able to predict the next move for many markets.
This is a skill well worth developing. It can lead to mega-profits.
Each Elliott Wave has its own particular personality. That is because, in a trend, where you are along it, there are different motivations of the traders and their assessment of value in the market. For instance, at the start of a new uptrend (say), the market has been beaten down, so that many view the market as undervalued, the shorts (I should mention here that in the futures markets, there is an equal number of short positions as long) will be looking to take profits as the market moves against them, eroding their gains.
The early longs will be encouraged by the upmoves, and buy more (Wave 1). There is plenty of doubt expressed as to the validity of the upmove, since we had all been used to seeing a bear market. This propels the market higher, and after a while, there is early long profit-taking and late selling by the late-to-the-party shorts.
This finds support (Wave 2), and fresh buying comes in which moves the market through the old high at Wave 1, where there are plenty of buy-stops. This thrusts the market higher and higher in a huge Wave 3. This turbo-charged buying is the reason why Third Waves are really wonders to behold – there is no stopping them. In Third Waves, more and more people realise that this move is for real – and they find plenty of “fundamentals” to justify it (those reasons were hidden in Wave 1, of course).
Then, Wave 3 exhausts under profit-taking and fresh selling, and a dearth of new buyers and retraces in Wave 4. This wave is looked upon as simply “profit-taking” in a massive bull market. Bearish opinions are very thin on the ground, even in Wave 4.
Then, fresh buying comes in and takes the market into new high ground in Wave 5, where the majority will believe the market is going to the moon. This is the wave that very often shows internal weakness (such as negative divergences).
Then, the market suddenly reverses, often for no apparent reason that can be explained on the News, (but that doesn’t stop them trying!) Thus the character of the market depends on where you are on the Elliott Wave count.
This is a simplified blow-by-blow account of the progress of a bull trend as seen through the eyes of a trader. In summary:
- Wave 1: Moves up from undervalued/oversold level, with high bearish consensus – end of the world scenarios – prominent ‘gurus’ pronounce much lower values ahead – much ‘bad’ news in the media. After the low, less ‘bearish’ news come out – first ‘green shoots’ appear. Rises to Wave 1 top. But few believe in the rally. Most think it another short-covering rally to be sold into.
- Wave 2: More ‘bad’ news out – pessimism even stronger that at the lows – but market holds above. Then, some ‘good’ news emerges, surprising the bearish pundits and the market moves up. It gathers momentum with most sectors moving up strongly with high breadth, high volume trading – people finally have that ‘feel-good’ feeling in a huge Wave 3
- Wave 3: This is usually the longest wave. Eventually, values get overstretched in the enthusiasm – profit taking comes in – notes of caution sounded. Some surprisingly ‘bad’ news emerges – prices fall into Wave 4. Many small traders buy in near the top of Wave 3.
- Wave 4: Prices find a low as late-comers arrive at the party – market rallies to new high with universal enthusiasm – but internal breadth weaker than in Wave 3 at the top of Wave 5 – only a few sectors keep the faith – most sectors have already topped out. Prices now seen as over-valued. Market then has topped out and begins a re-valuation to lower levels – and a whole new Elliott pattern forms.
Of course, these scenarios can play out over weeks, months, and years in the stock market. They are less extreme on short time-frames.
But this gives you a way of seeing where the market is at any point along the wave structure in relation to where it has been and where it is likely to go.
Incidentally, commodities such as Gold often show a ‘spike’ in a 5th Wave in a bull market, where the price suddenly runs up manically, and then falls back down just as quickly – often in minutes. Unless you are watching your screen you will not be able to catch these moves.
Stocks, on the other hand (especially the indices), rarely, if ever, show these sharp spikes, but roll over gradually at major tops and bottoms. That is one reason why significant market tops and bottoms are rarely recognised at the time. But using our Elliot Wave knowledge and our other technical tools, we can have a definite edge over most other traders!


Join the discussion