The Fluctuating Fortunes of the ZAR and the USD
Nov 3, 2013 at 10:29 am in Fundamental Analysis by Brett Chatz
Unbeknownst to many, the ZAR was stronger than the USD for over 20 years!
The Republic of South Africa, or RSA, is home to some 55 million people. This mineral rich country holds vast supplies of the world’s gold, uranium, coal, copper and other natural resources. As a mineral rich haven, South Africa has attracted the attention of investors all over the world. Massive amounts of foreign direct investment (FDI) have helped to establish South Africa as an economic powerhouse on the African continent, and one of the most prominent emerging market economies. However, the country has been racked by political upheaval, rampant crime and gross malfeasance in recent years. But those factors have hardly factored in to explain the fluctuating fortunes of the South African rand and the US dollar. One of the reasons why the ZAR has seen so many highs and lows against the USD is the fact that global uncertainty results in the massive withdrawal of funding from emerging market economies. As South Africa is an emerging market economy, it is often one of the first to feel the effects of divestments initiatives.
The History of the South African Rand and the US Dollar
Contrary to popular belief, the ZAR has actually enjoyed ranking status over the USD for many years. The South African currency – the rand – was first circulated on 14 February 1961. Prior to the adoption of the rand as the chosen currency of the country, the Republic of South Africa (RSA) used the pound. As a former British colony, all South African economic activity was denominated in pence, shillings and pounds. With regards to the USD, the rand had an exchange-rate conversion of R1 to $1.4. In other words, every R1 was worth $1.40. This continued for 20 years between 1961 and 1982. During this time, South Africa was under the vice-like grip of apartheid. During those years, and beyond, international sanctions against South Africa became more and more stifling. The US in particular, spearheaded efforts to impose harsh economic penalties to try and break the apartheid grip on the land. The first chinks in the rand’s armour were noticeable in March of 1982. The dollar was then trading at a range of one US dollar for $1 to R1,30. This continued until the middle of 1984. From 1985 onwards, $1 was trading at R2.
Following President Botha’s speech to Parliament in 1985, the rand slipped further against the US dollar. The currency fluctuated somewhat until 1989 but from then on its depreciation against the US dollar continued unabated. During the 1990s, South Africa made the peaceful transition to black majority rule. However, the global uncertainty surrounding this change led to a further depreciation of the currency. At the time of the second democratically elected President’s inauguration – President Thabo Mbeki – the rand slid precipitously against the dollar. Political events such as President Robert Mugabe’s infamous land grab program where land was confiscated from white farmers and given to workers sent shockwaves throughout the Western world. Global events were further destabilised with the horrific acts of terrorism perpetrated on September 11, 2001. These catastrophic events and the actions that followed led to a rapid devaluation of emerging market currencies, the rand being one of them. In fact, the rand had plummeted to its lowest level in recorded history in December of 2001 – R13.84 to US $1. Owing to decisive action by the Reserve Bank in South Africa, the rand made a recovery soon thereafter and was trading at a fraction under nine rand to the dollar. Between 2004 and 2005, the rand strengthened again as the economic fundamentals of the South African economy became apparent. However, by 2006 the rain began its downward motion again. Economists often cite many reasons for the precipitous fall in value of the South African Rand (ZAR) against the US dollar. Foremost among these is the fact that the South African economy was in a current-account deficit. This was actually measured at 7.3% of the GDP in 2007. Working in tandem with this current-account deficit was an unusually high inflation rate approaching 9%. Taken together, high inflation and a large current-account deficit do not bode well with investors from Western countries. The predicament in South Africa was further worsened with the inability of the national electricity provider Eskom to sustain the electricity requirements of the growing population. Defunct machinery, overburdened power stations and ageing equipment meant that rolling blackouts would be the order of the day. This problem continues to this very day.
Historical Charts of the USD/ZAR Currency Pair
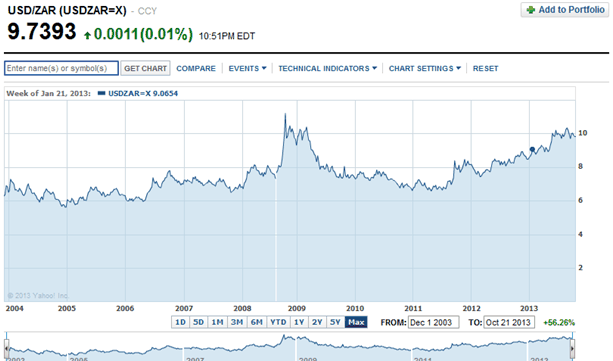
The above chart represents the USD/ZAR currency pair from 2004 through 2013. It is clear from the chart that the rand was hardest hit during the 2008 financial crisis. At that point the rand was trading at R11.21 to the US dollar. The lowest point since 2004 appears to be on 27 December 2004 when the rand was trading at R5.64 to the US dollar. The most recent rand dollar exchange rate as quoted on 21 October 2013, was R9.83 to the US dollar. The dramatic Variance between highs and lows of the US dollar to the ZAR presents speculators with massive opportunities for profit. In fact, it is this very speculation that has had marked effects on the fluctuating fortunes of the ZAR. When the USD/ZAR exchange rate is unfavourable towards South Africa, exports from South Africa become highly attractive to American companies. On the contrary, when the South African rand strengthens, more US dollars are required to purchase those exports and they become relatively more expensive. Thus, from a global perspective, a weak South African rand is favourable, but from a local perspective a strong South African rand has more buying power for foreign produced goods and services.
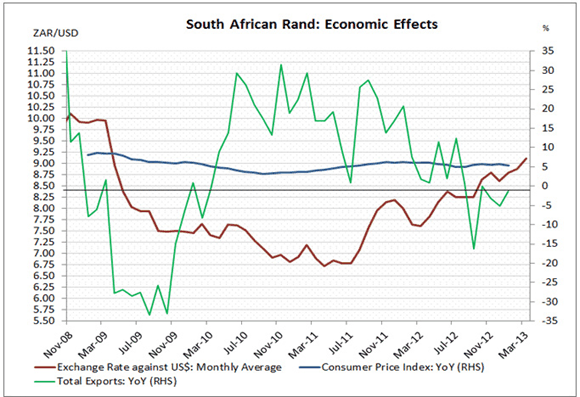
The above chart provided by CEIC reflects many interesting facts about the ZAR and USD. For example is apparent by way of the red line that the South African rand strengthened from above R10 to every dollar in November of 2008 to around R6.75 to every dollar in March of 2011. Since that time the rand has continued to depreciate with only temporary appreciations between 2011 November and 2012 February. Since that time the rand decreased until the present day. As can be expected exports decreased as the rand increased and increased as the rand decreased in value. This trend is one of the most obvious economic consequences of a steadily declining currency. As mentioned earlier, when the rand becomes relatively cheaper per dollar, so the attractiveness of South African goods and services to the export market increases. Any anomalies that are reflected in the chart are the result of the lag effect of economic activity. Note that the consumer price index – a.k.a. Inflation – has been able to stay between 9% and 5% throughout the five-year period. This is generally seen as a positive factor for the ZAR. However, it must be noted that the central reserve bank in South Africa was targeting inflation rate of between 3% and 6% and many times the CPI was outside of those boundaries on the wrong side.
About the author: Brett Chatz is a graduate of the University of South Africa, and holds a Bachelor of Commerce degree, with Economics and Strategic management as his major subjects. Nowadays Brett contributes informative essays for the globally renowned spread betting and CFD trading provider, InterTrader.com.


