Continuation patterns are just as important reversal patterns. They may help give you another chance to enter a position, or, if you're already trading an instrument that presents a particular pattern, they can help bring you peace of mind. Now we focus on a family of macro continuation patterns called 'triangles'.
 |
Continuation patterns are just as important reversal patterns. They may help give you another chance to enter a position, or, if you're already trading an instrument that presents a particular pattern, they can help bring you peace of mind. Now we focus on a family of macro continuation patterns called 'triangles'.
Triangles come in all shapes and sizes. They are terrific tools that can help you to pre-empt a breakout. Once you recognise them, they are very easy to spot as they are forming. The ascending triangle is one of the most reliable members of the triangle family.
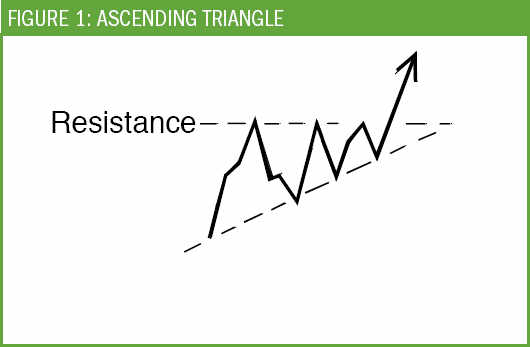
This pattern shows a series of higher lows that create an up-sloping bottom. A level of horizontal resistance forms the flat top of the triangle. The top is most often completely flat, but if not it can still fulfill the definition of an ascending triangle. The ascending trendline must display at least two higher low prices to be valid. The ultimate breakout may happen before the upward sloping trendline and the horizontal line intersect at the triangle's apex (see Figure 1).
This pattern often forms in an existing uptrend. It is likely to suggest uptrend continuation because the breakout is usually in the direction of the slope. Volume frequently reduces as this pattern reaches the apex and expands at the point of breakout.
During the formation of the pattern, price action is usually fairly compacted. If there is a lot of time between the share prices touching the boundaries of the triangle, the pattern may not be as predictable. It is important to watch for signal failure. Trading below the level of the upward sloping trendline is a bearish indication.
A strong level of resistance is often formed by pockets of traders waiting for the share price to hit a certain value before selling. The horizontal line can coincide with a round dollar value for this reason. The uptrend line that forms the bottom boundary of the triangle shows that traders are interested in paying more and more for this share. Once the lid blows off, all hell breaks loose and the bulls charge.
Traders often cultivate ego-defensive attitudes. They look for evidence to confirm a decision that has already been made. The upward slope of the triangle suggests market participants have already made the decision to drive the share price upwards. The breakout merely confirms this decision.
You can estimate the size of the expected price move using a triangle pattern. The way to do this is to measure the height of the triangle at the start of the formation and then add this result to the horizontal line. This also provides you with a rationale regarding why tall triangles tend to produce fairly big kicks in price action. Short-term traders could sell their long positions when the share approaches this price target. Medium-term traders are more likely to endure the expected consolidation rather than to close their positions at this price target level.
Call option buyers love this pattern. Share traders also get a kick out of it, as do put option writers and call warrant buyers.
 |
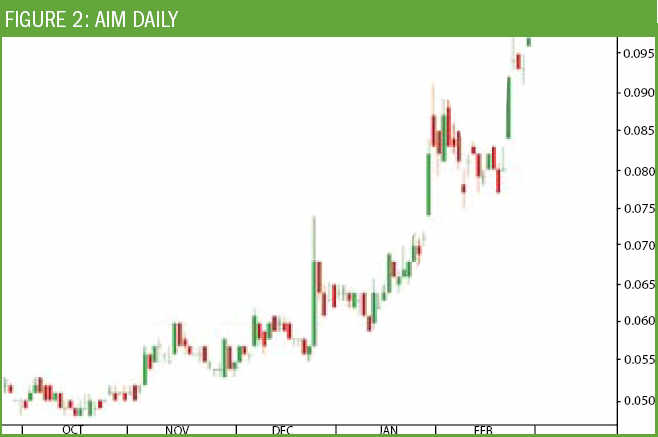
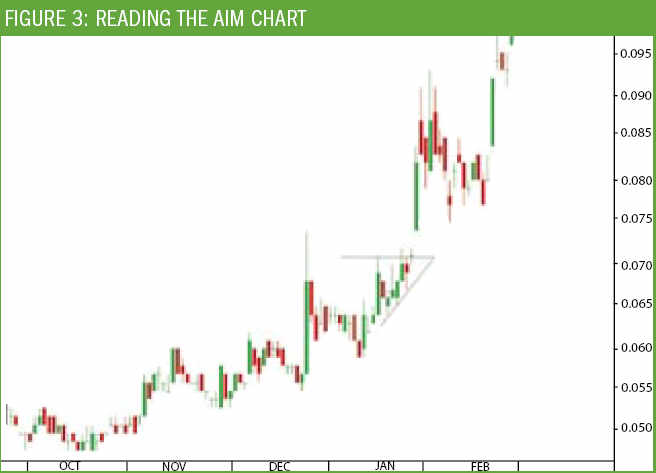
The breakout doesn't often show signs of pullback, so it's good to get involved as soon as you can. Because the medium-term trend is already upwards, you can act with a fair degree of certainty before the breakout has occurred. Towards the apex you'll notice quite a few small-bodied candlesticks, suggesting indecision.
Aggressive traders often enter on one of these small-bodied days, rather than waiting for the breakout. Often a very pointy apex does not form with a strongly uptrending share displaying an ascending triangle. The breakout is likely to occur in the final third of the triangle, so be prepared for a breakout that jumps before you are ready to catch it. Tricky little devils, aren't they?.
Looking at the patterns triangles make got me thinking about the speed of breakouts, and why some patterns consistently recur on charts. Triangles typically form fairly quickly and break out dramatically. Other macro patterns take a long time to form, but the breakout is much more gradual when it finally occurs.
As I was thinking along these lines, I wondered if there was any correlation in human behaviour, and how we might use this information to our benefit.
I had the pleasure of learning how to trade options with a neighbour who was 72 years old at the time. Elizabeth took quite a long time to grasp the basics of options, but once she had cemented the principles, she seemed to go from strength to strength. I remember her saying to me one day: "I think it's wonderful how quickly you pick up all of the terminology." I said to Elizabeth, "Yes, but you seem to avoid the silly mistakes that I tend to make as a trader - I wonder why that is?"
 |
There seems to be an interesting difference between how younger minds and older minds process information and form conclusions. The common way of thinking about this is that older minds 'slow down' and become less efficient as they age. Although some functions such as reflexes and reaction times do take comparatively longer, this doesn't affect mental acuity.
There are many different effects of aging, such as a decline in the ability to retrieve memories, most often short-term ones. Laying down new information is also more labour intensive. However, brain-scanning technology shows that there are advantages to the information processing abilities of the mature brain. Primarily, older brains have had the chance to form more connections between the hemispheres, and have become more adept at accessing their previous knowledge and experience. Their neural networks are surprisingly flexible. So, what older traders lack in speed of processing is compensated for by depth of experience, which assists in the learning process.
More mature traders also seem less subject to distraction and can maintain goal direction. Computerised tests to examine this issue have reached fairly conclusive results. In one 'distraction test', subjects were told to use a mouse to click on an arrow that pointed in a certain direction, as soon as it appeared. Younger subjects cut through the confusion of the conflicting signals more quickly, but made more mistakes. The older test subjects took a bit longer, but their accuracy was superb.
From my experience in training traders, these test results are directly applicable to the way traders learn and perform. I remember training a couple of university students in around 1998, who were incredibly keen and raring to go. They grasped the knowledge required almost immediately, and scored extremely well in the review sessions. However, when it came to trading in real life they had difficulty sticking to their trading plan, got frustrated when something out of the ordinary happened on a chart, and found the pub and girls much more interesting hobbies.
In contrast, the more mature traders I have trained have sometimes struggled with the detail and technicalities of trading. They have sometimes felt inadequate in the face of advanced technology, such as online broking systems. When they lack formal education, sometimes these more mature traders tend to doubt their own abilities. However, once these barriers are overcome these traders show a singleness of purpose, dedication, and a commitment to following a trading plan that is unrivalled.
So whether you are coming to trading with a youthful glow or with an outlook that has weathered a few more seasons of life experience, you can achieve trading success. It's a matter of being aware of your skills and limitations and compensating where possible. The market doesn't discriminate on the basis of age, race or personal background. It's the best equal opportunity employer in the world.
The content of this site is copyright 2016 Financial Spread Betting Ltd. Please contact us if you wish to reproduce any of it.