Bollinger Bands
Bollinger Bands are one of the more widely known technical indicators around but least understood. They are also very dynamic and have many uses. Invented by John Bollinger, they are best described as a way to visually measure volatility. What if you could create trading opportunities just from using bollinger bands and nothing else? Well there is a way and it is described in my free online video: 4 Powerful ways to use Bollinger Bands.
Bollinger bands are constituted by a middle band with two outer bands. The middle band is a SMA (simple moving average) normally set at 20 periods.The outer bands are normally set 2 standard deviations above and below the middle band. BandWidth simply measures the difference between the upper band and the lower band.
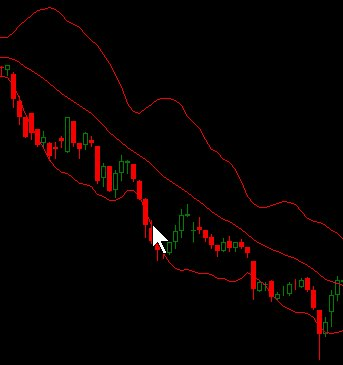
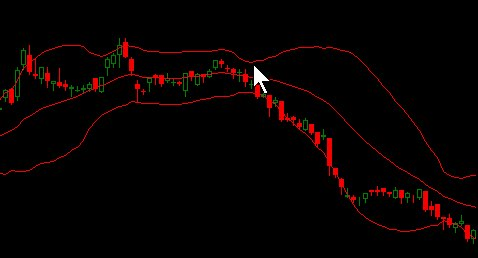
Bollinger bands track price volatility and can be applied to any financial asset. They tend to move in wide bands during trending phases of the markets, particularly in fast-moving downward markets. As trends weaken volatility decreases and Bollinger bands narrow. The tightening of Bollinger bands can be the precursor for a big move.
So how do Bollinger bands work? Bands track price volatility by measuring the standard deviation of price action over a period of time, usually 20 days. This deviation figure is doubled and applied to a 20-day simple moving average so as to create two bands, one above and one below the 20-day simple moving average. There may need to be changes in the deviation multiplier where the historic period is different to 20. In the case of a 10-day Bollinger band the multiplier decreases to 1.9 although this increases to 2.1 where a 50-day Bollinger band is used.
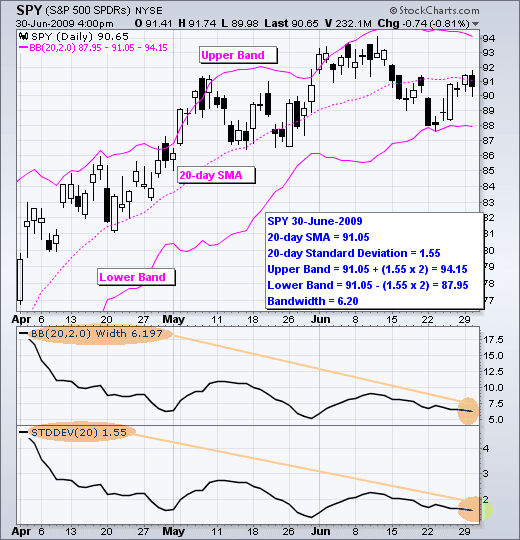
The chart above shows the S&P 500 ETF (SPY) with Bollinger Bands, BandWidth and the Standard Deviation. Note how BandWidth tracks the Standard Deviation (volatility).
Bollinger Bands are in effect similar to the moving average envelope, but the distance that they are placed from the moving average line varies. The distance depends on the way the price is performing, and is based on a statistical number called the ‘standard deviation’. This is calculated from how volatile the price is, and thus gives a more relevant figure. Usually the bands are placed two standard deviations each side of the moving average and statistics tell us that 95% of the price movement should be contained in this band. Here’s the same chart again, but with Bollinger Bands instead of the fixed envelope.
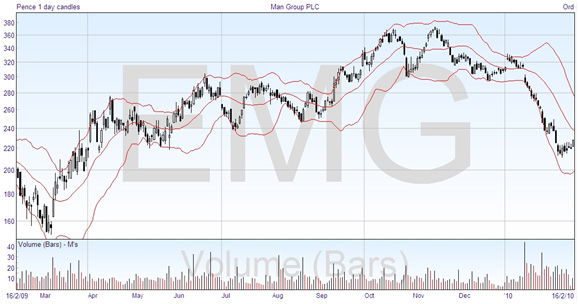
You can see how much better the Bollinger Bands with their variable envelope wrap the price movements. One interpretation of the bands is to consider that the market is overbought when the prices touch the upper band, and oversold when the prices touch the lower band, and subject to other indications that we’ll discuss in the next module that may mean a correction is coming. The uptrend on the left is still showing an overbought condition, as it is touching the upper band, but the volatility element in the calculation has expanded the band so that the prices do not appear so excessive.
Targets
One of the simplest uses of the Bollinger Bands is to think of them as price targets. For example, when in May the prices bounced off the lower band and then rose past the moving average, the upper band became a price target. You can see that the prices followed it fairly closely through June. The moving average, the centre line, is considered an intermediate target, but once it is passed then the opposite band is usually reached.
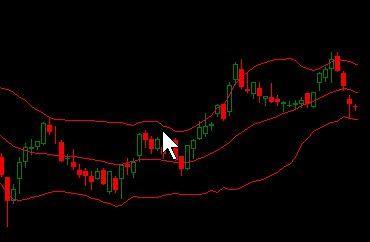
More generally, in an uptrend you can expect the prices to fluctuate between the moving average and the upper band, and in a downtrend the prices will be between the moving average and the lower band. This shows clearly in the chart above. If the moving average is crossed, it warns that the trend may be changing.
Volatility
As mentioned, the bands are drawn with the distance from the moving average line depending on the current price volatility. Non-normalized BandWidth is a measure of the distance, or difference, between the upper band and the lower band. BandWidth decreases as Bollinger Bands narrow and increases as Bollinger Bands widen. Since Bollinger Bands are based on the standard deviation, falling BandWidth mirrors decreasing volatility and rising BandWidth is an indication of increasing volatility. This means that the size of the bands expands and contracts across the chart. Usually if the band gets narrow, indicating constraint to the price range, the market is about to breakout and start on a new trend. When the band gets wide apart it warns of a slowing in the current trend. The theory is that periods of low volatility are followed by periods of high volatility.
The Squeeze
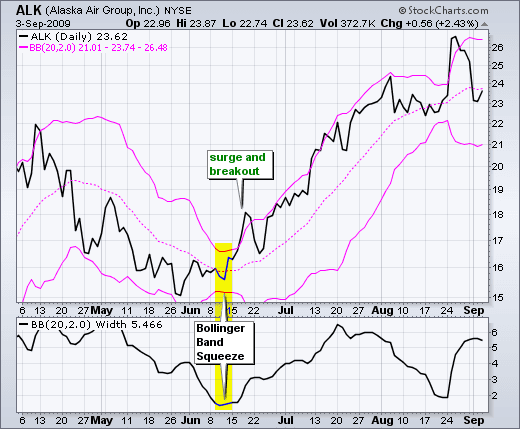
The above chart illustrates Alaska Airlines (ALK) undergoing a squeeze in mid-June. After the stock price declined in April-May, Alaska Airlines stabilized in early June as Bollinger Bands narrowed. BandWidth dipped to around 1.5 making the Squeeze play on in mid June. With the share around 15-16, BandWidth was less than 10% of the stock price. With the following surge above the upper band, the stock broke out to trigger an extended rally.
Similar to momentum indicators, extended periods of strong trending action may keep prices round the upper or lower Bollinger bands for a long time. Should the price close outside the opposite Bollinger band (say, the lower band for a rally), a warning is triggered that the trend may soon be about to reverse. Bollinger bands normally contain most of the price action (up to 90%), so any move outside their range is considered important – irrespective if this is a confirmation of trend strength or an early tip of a potential trend reversal.
As with most technical analysis, Bollinger Bands can be used in different timeframes, and can be valuable when looking at longer term trends over periods of years. Bollinger bands tend to work better when used with momentum indicators (Bollinger bands were not designed to work as a standalone tool) such as the Relative Strength Index (RSI) or Commodity Channel Index (CCI). A move out of an oversold condition for the indicator when the price hasn’t breached the lower Bollinger band could be seen as a buying opportunity. Likewise, a drop out of an overbought condition in a momentum indicator which the price honouring the upper Bollinger band could be interpreted as a sell signal. We’ll come to it later when talking about a trading system in Module 11, but you will usually want to combine two or three indicators in your plan, from different parts of the data such as momentum or volume, so that you have confirmation of your trades.
Practicalities: How to Use Bollinger Bands
Experienced traders develop their own way of using indicators, whether it be combinations of several indicators, or powerful combinations of the one indicator, used in such a way to create trading opportunities that most other traders can’t see.
There are four ways I look at Bollinger Bands. One is to establish trends, then to establish corrective moves. I feel that establishing when trends and then more importantly when corrective moves take place is an important part of becoming successful in trading.
Another powerful way to use Bollinger Bands is to look for volatility break outs. Volatility break outs can provide handsome rewarding trades when used properly, but more importantly when noticed!
Then I use what I call higher time frame support and resistance. All of my mentors from the past had this in common (among other things), they all paid attention to the higher time frame. Using Bollinger Bands when looking at the higher time frames can add a very powerful new dimension to your trading.
And then we have divergence. A lot of traders use divergence with indicators such as MACD, stochastics, RSI and so on, but most are unaware that you can use divergence with Bollinger Bands.
When you combine some or all of these methods you will begin to uncover some powerful trading opportunities. What’s more, you will be able to take advantage of trading situations that most other traders will be unaware of. This is the power of Bollinger Bands.


Join the discussion