Module 8 – Further Charting
Introduction
We covered a lot of what you have to know about charting in Module 2 – but in this Module there is information that will be worth knowing and help in your trading. One of the aspects was already mentioned, and that is candlestick charting, which is a convenient way to view price information that allows you to take in the information more quickly and clearly.
Candlestick charting, or candle charts, have only recently been used in Western trading, having been introduced in the 1980s, but have been used for centuries in Japan, where they originated. Some traders find Japanese candlesticks very useful and insist that they find it very difficult to trade without them while others put them down as simply a distraction, adding very little to one’s ability to predict the markets.
As for myself, I disagree with both lines of thought. I can definitely trade without candles but I choose to utilise them because I know from experience that they can provide invaluable information. Candlesticks do have an advantage over the previously used bar charts, however, that they have caught on with many traders. For instance candlesticks are a lot more visual than bar charts which allows you to identify the patterns more easily.
The issue is that some stock market traders spend too much time trying to memorize all the theoretical patterns that can be formed with candlesticks without realising their true value in giving a picture of market sentiment.
Another chart type which is covered in some depth is called point-and-figure charting, which is noticeably different from the charting techniques you have been introduced to so far, and will give you other ways to find your trades. These charts are older than bar charts in the Western world, with references dating back to the 19th century.
I will also mention some other variations on charting, which you can explore if they appeal to you, but that won’t have a drastic effect on your trading if you don’t. In other words, not many traders use them regularly, although each has an angle or a purpose.
Candlestick Charting
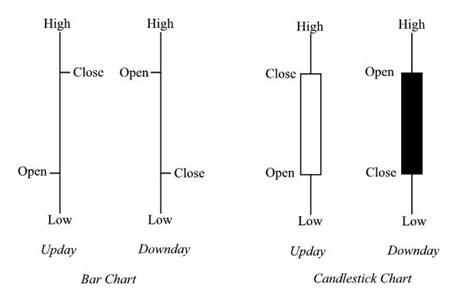
Here’s a reminder of how the candlestick chart differs from the ordinary bar chart -:

As you can see a candlestick has the same four elements that make up a standard bar chart, i.e.the open, high, low and closing prices for the day. The bars on the left have just short ‘tics’ to show the opening and closing levels, whereas the candles on the right have ‘real bodies’ which are easier to see at a glance. They have the additional feature that you can tell whether it was an upday or a downday by the color, or by whether the body is filled (black).
The Japanese study of candlesticks and their patterns has taken place over generations, and the different shapes and combinations, with varying lengths of body and wick, have been well documented. We’ll look at the basic shapes first, with their interpretations, and then review the most common and most useful patterns here. One of the problems is that there are too many candlestick patterns – I documented nearly one hundred patterns in my book, but many are rare, and you can’t expect to remember and use all of them on a regular basis.
You don’t need to know each and every candlestick pattern; you simply have to understand the market sentiment picture they are conveying. Once you understand the principles of interpretation, you should be able to determine the meaning for yourself. Each candlestick, irrespective of the timeframe, holds within it a story of who is presently in control: the Bulls or the Bears? The mere fact that a share prices closes higher or lower ignores some data in the picture. The candlestick, however provides a better and is a whole lot more than just a record of the final outcome. A candle with its open, high, low, and closing prices can reveal many things.
With the power of computers, some charting software can be set to automatically point out the common patterns – ShareScope has this feature, which you will see later in the charts, identifying 32 different patterns. There is no pattern that works all the time, and candlestick patterns should never be expected to provide a trading indication on their own. You still have to look at other factors before you trade. I’ll cover some general guidelines for using them later.


Join the discussion