Market Example
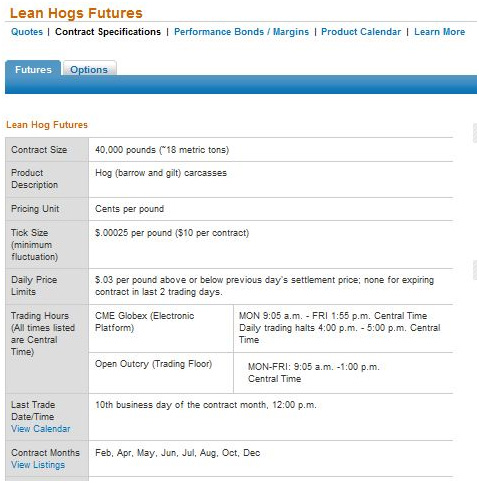
Just to give you a taste of the markets, here are some screenshots from the CME Group website, www.cmegroup.com. These are for Lean Hogs. First here’s the specification sheet which tells you what the contract covers.

You can see that it defines the amount, the price limits referred to above, and the contract months, among other things. It’s this standardization that allows trading to take place so freely and easily.
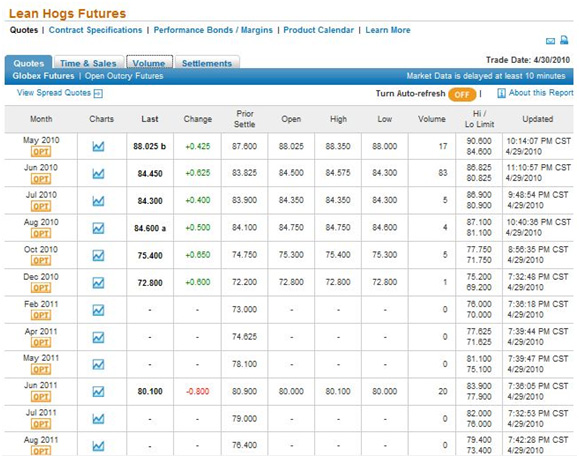
Next we have the main pricing screen, which shows the prices for different months of delivery and how they have changed over the trading day.

Looking back to the specification sheet, you can see that the price is in cents per pound. $.88 per pound, the price for a May delivery, means the total contract is worth $35,200 for the 20 tons of bacon. If the initial margin for this was 10%, it would be just $3520.
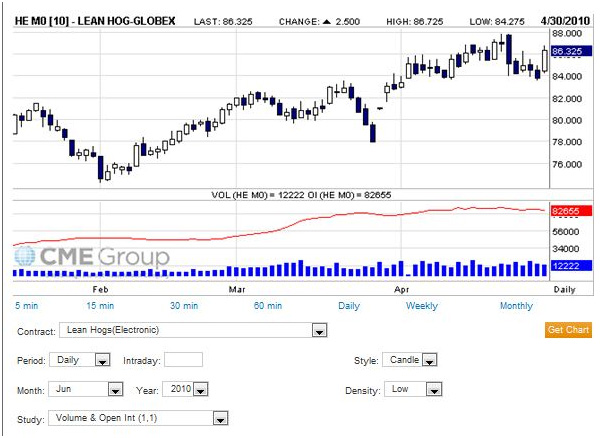
Finally, you can see that each of these contracts for different delivery dates has a chart available. The CME website gives you a number of analytical tools for these charts. Below is the chart for June 2010 delivery.

You can see a familiar candlestick chart, exhibiting trends, that you would be able to apply your technical analysis education to.


Join the discussion