Gaps
As a final comment on price patterns, I now want to discuss price gaps. I left this topic over from the previous module as it was getting so long. Gaps, as you might expect, are spaces in the price chart where no trading has taken place. All the trading in one day has taken place completely above or below the previous day, leaving a gap or window, as the Japanese call it on candlestick charts, between the trading ranges.
If the gap is to the upside, this can generally be regarded as a strong indication. The corollary of that is that gaps to the downside are a sign of weakness. While you can get gaps on weekly or monthly charts, and when you do they are significant, you’re more likely to see them on daily charts.
Gaps in Trading
One of the trading sayings is that ‘gaps are always filled’, implying that even if the price jumps over the space, it will in due course come back there. That’s not really true – some types of gaps should get filled, but others won’t. There are three types of gaps, and they each have different significance.
Breakaway Gap
The breakaway gap is often seen at the end of a price pattern, and is a sign of a strong breakout to the new direction, in the case of a reversal. It will usually have a heavy volume, such as you expect when establishing the new trend, and it’s not likely that the price will come back and fill this gap.
This type of gap shows strong market action, as you get when a pattern resolves and breaks out, and will give you confidence that the trend is sound. Although you don’t expect this gap to be filled, and the heavier the volume is the less likely that is to happen, the price can return and use the gap as support in an uptrend or resistance for a downtrend. If the price should come back and fill the gap, then that shows a failure of the breakout and trend.
Runaway Gap
The runaway gap is a good sign of a strong trend, and occurs while the trend is moving robustly. It’s really a sign that the trend is moving fluently. It’s often around the middle of the move, so sometimes it is known as a measuring gap – some analysts will project the distance the trend has already covered, and expect it will continue for the same distance again. Having said that, you can also sometimes see a series of several runaway gaps in a move.
As before, the gap should act as a support or resistance on any retracement, and probably will not get filled. A closing of the gap would be regarded as weakness of the trend.
Exhaustion Gap
This is the type of gap that may well get filled. As the name implies, it’s a kind of last gasp at the end of a move or trend. The price will leap upwards, in an uptrend, and the trend will fade, with the prices coming back soon, probably to fill the gap. In fact, when the price closes below the gap, this is a further indication that what you are looking at is the exhaustion gap. As you might expect, when you do get the close below the gap this is a strong bearish signal.
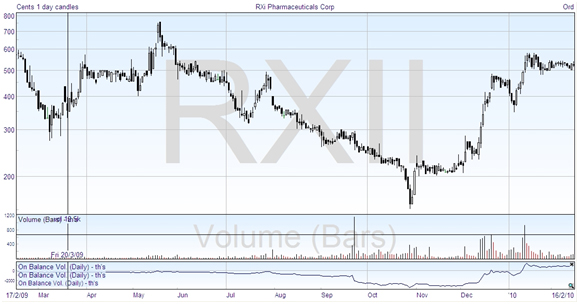
Here’s a chart which illustrates two types of gap. Towards the centre of the chart, there’s a gap downwards, a breakaway gap, which signals the start of a heavy decline. Over to the right is an exhaustion gap in December, in the uptrend, and you can see that this is filled in a few days. In this case the price trend reversed again and continued up after the retracement.

Island Reversal
The island reversal pattern is an example of two types of gap. Sometimes after an exhaustion gap, at the end of a trend, the price will trade sideways for a few days and then gap in the opposite direction, with a breakaway gap, to start a reversal. This leaves the sideways price action as a kind of ‘island’ with a space on each side. This is a strong reversal pattern.


Join the discussion