The Markets and Indices
We have all heard about the Stock market. It is always one of the evening News’ favourite things to mention, especially if there has been a big drop. The papers also love it when there is a big drop, so they can use the words ‘Crash,’ at every given opportunity. But what are they, what do they mean and are they any use to us.
What are they!
The main and most popular indices are a group of selected shares that represent the country’s top 500, 250, 100 or even top 30 companies. The shares are then added together and are then presented as one Index covering that share market.
The most popular are as follows:
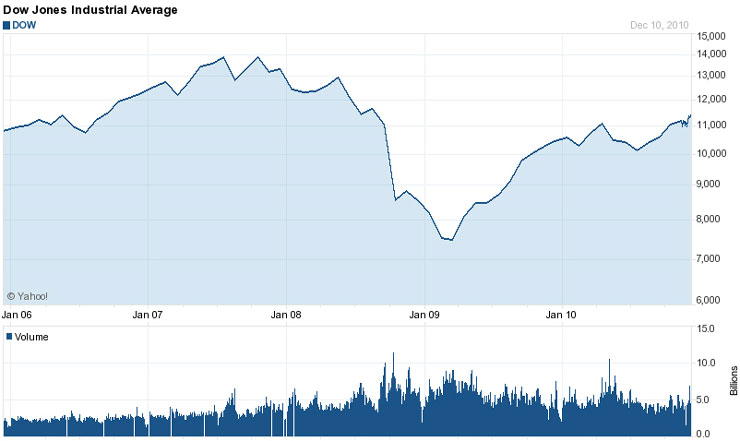
DJIA
America’s largest and consists of the States very top companies. DJIA stands for Dow Jones Industrial Average. I will be talking a little more about our friend Mr. Jones later as we use some of his legendary techniques. Usually referred by its first word ‘The Dow theory’.

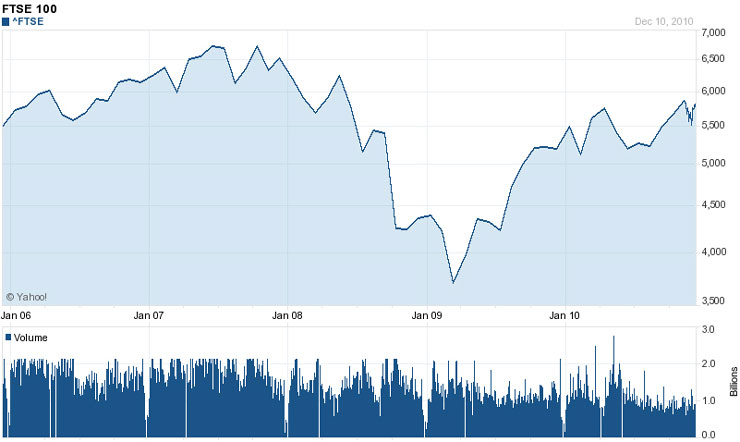
FTSE
The FTSE (pronounced ‘footsie’) comes in two sizes 250 and 100, there are other variants but we shall only concentrate on the most popular. The most popularly quoted index is the 100. The FTSE 100 is the UK’s largest and most popular Index and includes the countries top 100 companies. FTSE is an acronym for Financial Times Stock Exchange 100. Although the FTSE only covers 100 shares, the capitalization of the London Stock Exchange (LSE) is over 70%. Therefore, the FTSE 100 gives a snapshot of the LSE UK market. So a great deal of people pay attention to indices like the FTSE and the Dow.
One thing that you have probably noticed about the above charts and if you haven’t I suggest you go and take a closer look, is that both charts look very similar. Now it has nothing to do with that we both speak English or that we’re cousins etc. It’s because the American markets reflect to some extent global economy and this is reflected the following day (New York Stock Exchange NYSE closes later than UK, at about 9.30pm GMT) in the FTSE. There is an old saying that will come in handy “When New York Sneezes London Catches a cold”.
Meaning, if the markets go down or up in New York you can expect the same to happen initially when the LSE opens. Obviously that is not always the case.

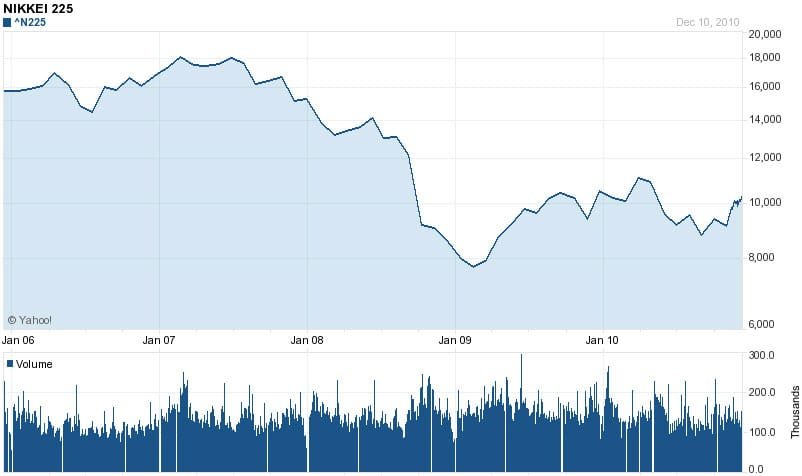
NIKKEI
The NIKKEI indices cover the largest companies in Japan. NIKKEI is published in Japan by Nihon Keizai Shimbun newspaper and is based on the average prices of 225 equities traded on the Tokyo Stock Exchange. There are other NIKKEI variants much like that of the FTSE and DOW, but for the main part most people take not of the NIKKEI (pronounced ‘nick-eye’).

There are many other indices but the above are the BIG three and the ones to take real note of. The other indices such as the DAX (Germany) the CAC (France) and others to, can all be traded in additionally to those above. Depending on your skill and how good your nerves are, you may want to stick to the more sure footed (as indices can be) indices above, until you get proficient in your skills in Technical Analysis.
The above indices are also broken down to smaller parts, which represent market sectors. Look into the back of any newspaper and you will see under the financial pages listings of shares broken down into their market industrial sectors. The list is quite extensive and covers anything from Insurance, Electronics, and Publishing etc. These like the main indices reflect the top companies shown, but per sector. So that you know which area of industry is strong and which is weak. Which may in turn reflect on the price of the FTSE 100.
As an example from the past: looking at the industrial sector for Oil (ENERGY & MINING). At one time tensions between the West and IRAQ were strained to say the least, the UN were trying their best but tensions and time were wearing thin. IRAQ has the second largest deposit of OIL in the world.
Since then a great deal has happened. Iraq has been ‘freed’ for want of a better word and the UN has recently handed over Iraq to its own people. Various sympathisers across the Gulf region at the time targeted the west’s oil supply pipelines. Obviously hiked oil prices again. As you can see, any threat to the supply of one the world’s currently most needed commodities creates a knock on effect.
So we can expect the price of OIL to rise and fall as tensions mount and ease – remember you can trade OIL which you will find in the commodities section of your brokers website. The instability (remember it’s all about psychology) and likely increase in the price of OIL has a knock on effect in the market Sector of ENERGY & MINING, so this can be hit in a good or bad way and the FTSE (and all shares) why?
Everything we buy has a cost in it that is the result of the actual supply, shipping & delivery of those goods. Now I just don’t mean when the item was sent to you or delivered to the shop you bought the item from – although there is a small percentage in there. I am talking about the cost to manufacture the item.
In everything some of the cost is the result of OIL. Now if you need me to tell you exactly why, then maybe Financial Spread Betting is beyond you, but for the sake of the few. OIL for ENERGY = Manufacture OIL = Petrol, Petrol = Transport, Transport = Delivered components, Components = Product. So the price of OIL because of the problems in IRAQ could have a long term knock on prices, people buy less, companies make less and profit falls, and share confidence is knocked in the longer term. BUT the psychology of all of the above takes place way before anything drastic such as war happens, that is why prices such as OIL fall or rise.


Join the discussion