Momentum Trading
When something is described as gathering momentum, the image of a snowball growing larger as it rolls downhill comes to mind. In the share market, momentum trading works in the same vein. A trader will either buy or sell on a market when there appears to be more activity (on the buy or sell side), other traders follow suit and it becomes a self-feeding mechanism.
Momentum trading is all about identifying a trend and coupling that with volume. This can be particularly good for day traders at certain times. When there are extreme trending price moves this can be very exciting and rewarding; when trending for the day, momentum trading is not so. Spikes may also lead to fading momentum.
Momentum is typically used while trading on news releases or finding trends that are moving strong and supported by high volume. In terms of the stock market, momentum simply measures the speed of change in price. You can get an indication of this by using various indicators. The most basic of these is the Momentum Indicator, which shows the difference between two prices, the current day and the price a certain number of days ago. You can set the number of days to suit your purposes. Typically, the greater the number of days, the smoother the indicator is, so you need to experiment to find what works best.
I do like to have targets for certain styles of trading however I most certainly am not going to say they are the be all and end all. There are many momentum systems out there that you would simply not use a target on as it would defeat the object of the system.
With the Momentum Indicator, the indicator is above the middle if the price is greater than it was the number of days ago. But it’s easy to see if the price is greater than it used to be. The value of the Momentum Indicator is that you can see the rate of price increase. The indicator may be above the middle, showing uptrend, but if it levels off the price rise is losing momentum. The Momentum Indicator is a leading indicator, as it starts declining before the actual price declines.
In most charting packages you can also find an indicator called the Rate of Change (ROC). This has a very similar principle to its calculation. It’s simply the latest price divided by the price of a number of days ago — and usually multiplied by one hundred to get a reasonable scale. It works similarly to the Momentum Indicator.
These indicators are both calculated on the basis of price action alone. Momentum is indicated by the speed of price change. But market action consists of both price action and volume. In fact, when trading it’s essential to look at volume to confirm any deductions you make from price action. If a price is trending strongly, it must be accompanied by increasing volume for it to be a real trend, and not just a fake out. Volume is available on all charting packages, and is usually plotted as a bar chart underneath the price. You can also get volume indications by plotting an equivolume chart or, preferably, a candle volume chart, and either of these will show increasing volume by having wider symbols.
It’s possible to go one stage further than this, and see not only how many shares changed hands, but also whether the market was driven by buyers or sellers. You can see this by the price that was used in the transaction, as long as you have access to the bid and ask prices. If the price is the higher bid price, then the buyer was pushing the deal; if these shares changed hands at the lower ask price, then the seller wanted to sell.
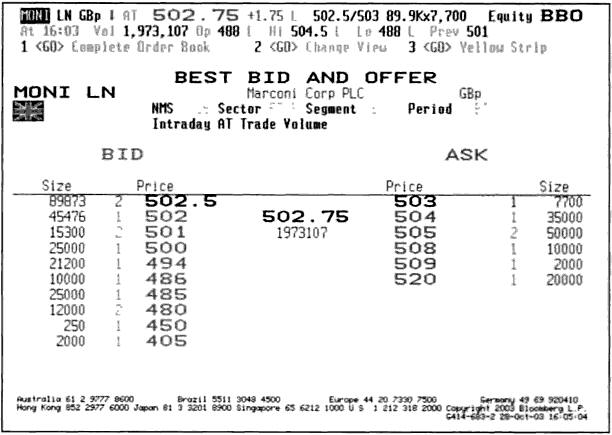
The key to momentum trading is finding out trading volumes, the actual number of those buying and those selling, and in what amounts. Traders can find out this information if they have access to what is called Level II data. This data is the entire breadth of information available from the stock exchange. These days, private investors can afford to subscribe to Level II services.
| Example
Clothing retailer New Look Plc is quotes in the market at 334 – 338. Over the past two hours, most of the volume is changing hands at 338p. A momentum trader would take this as a buy signal. The view is that because most trades are buy trades, the share is going to go up. |
| Example
Similarly, when looking at the order book (Level II data)) of a share, there may be tell signs that a particular share is going up or down. The screen below shows the order book for shares in telecommunications equipment maker Marconi Plc. You can see that there are more buyers than sellers at this particular time. More specifically, there are 89,873 shares on the bid or sell side and only 7,700 share on the offer or buy side – this would be a buy signal for a momentum trader. |
 |
Momentum trading is about the underlying sentiment of the market whether it is bullish or bearish.


Join the discussion