Method: Trading the Daily Cash Dow using Moving Averages for Entry Trigger
Trading the Daily Cash Dow  (280 Kb)
It is recommended that you have read and understood the previous trading method before reading this document.
The following method is my current preferred trading method. It performs very well in a trending day but can lead to a number of failed trades in a sideways or choppy market.
The previously presented rules/guides for stake sizing, capital management and stoploss usage should be applied as appropriate.
It is recommended that you have read and understood the previous trading method before reading this document.
The following method is my current primary trading method. It is a revision of the Moving Averages Method which is the result of further development and discussion with other traders.
The previously presented rules/guides for stake sizing, capital management and stoploss usage should be applied as appropriate.
This method can be used in a number of different ways to suit the risk profile of the trader. There is a cautious style, a middle of the road style and a real ‘walks with wolves’ style. My own trading tends to lean to a mix of the first two with an occasional dabble into the third. The merits of each will become clearer with further explanation but you need to be aware of all three as this knowledge will help to identify and anticipate exit points.
A single chart is used as the primary setup for trading using this method with the option of also using a 30 minute chart.
- One minute candlestick with 10 period Simple Moving Average and 30 period Exponential Moving Average and 60 period Exponential Moving Average
- Thirty minute candlestick with 10 period Exponential Moving Average – optional
To make it easier to see which way the 6 min EMA is going and take some of the subjective element out of the equation I have put a 60 period Ema on the 1 min chart (this equates to the 10 period on the 6 min chart) .
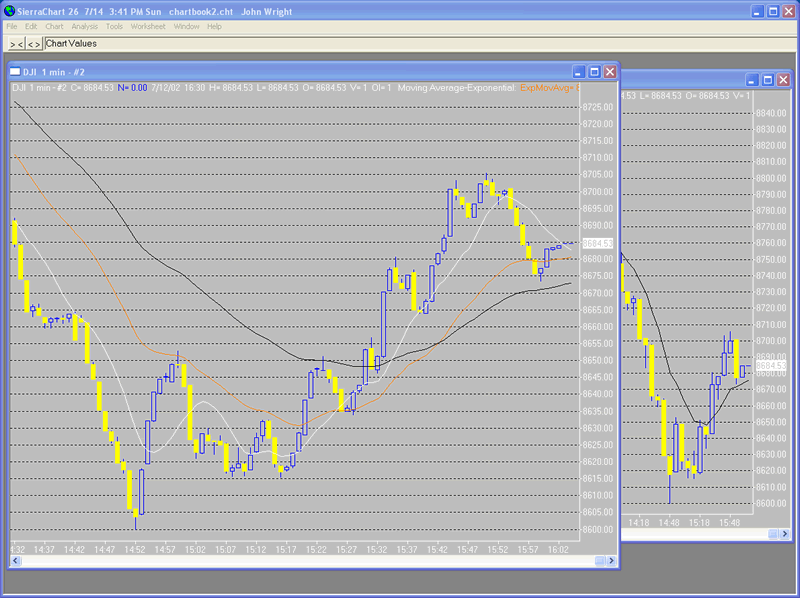
Your chart screen for this setup should look similar to the following.
 |
From the above you should be able to see the chart stack with the 1 min chart on top of the 30 min chart. Clearly shown in each is the Moving Average curves which will be used to trade using this method. On the 1 minute chart the 10 period SMA is in white, the 30 period EMA in orange and the 60 period EMA in black.
In broad terms the rules for trading the system are:
- Buys when 30 period EMA above 60 period EMA.
- Sells when 30 period EMA below 60 period EMA.
- Use 10 period SMA and 30 period EMA divergence to time buy/sell.
- Use the divergence of the EMAs to enhance the timing on the entries and exits.
- Buy into weakness ie. wait for the actual to be moving downwards when buying.
- Sell into strength ie. wait for the actual to be moving upwards before selling.
- When the 10 period SMA is close to the 30 period EMA then this is a good trade point as this also gives a good stoploss exit point should they cross.
- A wide divergence between the 10 period SMA and the 30 period EMA isa danger point / exit point.
- Only trade when the price is in your favour.
- Consider the strength of any move before closing a position for a stop loss because the SMA and EMA have crossed. If the move is strong then close immediately. If it is weak then consider allowing the stop to run for a few points.
- Do not trade when the EMAs are flat or have little clear direction.
- Watch for double bottom or tops on the 10 period SMA as this can signal a trend reversal (this can be seen in the above chart).
- Timid stop – opposite cross on 10 period SMA and 30 period EMA.
- Firm stop – opposite cross on 10 period SMA and 60 period EMA.
- Absolute stop – opposite cross on 30 period EMA and 60 period EMA.
This trading method can be enhanced by also looking at major support and resistance levels.
It does require that you use a subjective view of the strength of moves and divergence etc. but once you get a feel for it and you are prepared to sell into strength and buy into weakness then it should consistently give good returns. I suspect that this is also because when you do get it wrong it is usually immediately obvious and so you get out at a reasonable cost and because you are using the bias to your favour that returns are better when you get it right.
It is worth noting that I think this is a traders system – you have to trade it to learn to use it. It does not do all the work for you – you have to use your own discretion/judgment.
Cautious Style
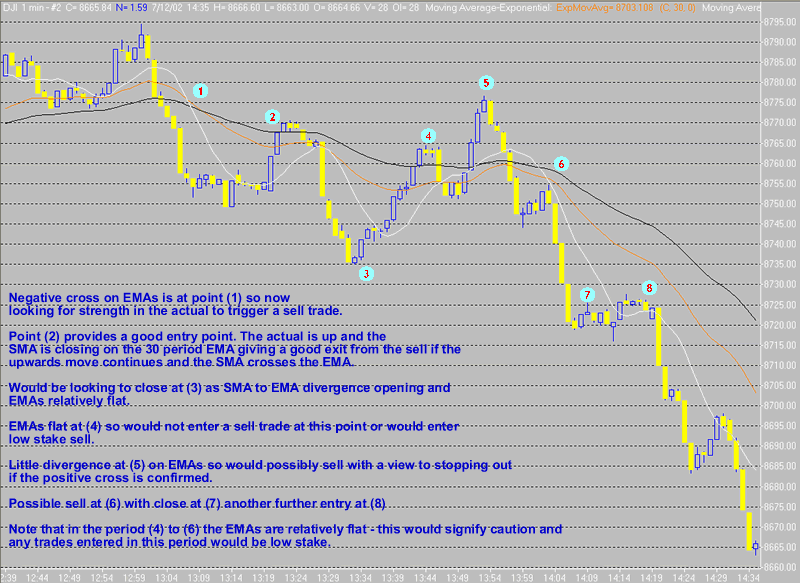
Trading using the cautious style we will only trade when the EMAs have a clear trend and the SMA is close to the 30 period EMA. The idealized trade point is when the MA criteria have been met and the actual is between the SMA and 30 period EMA and ideally between the two EMAs.
Middle of the Road Style
Slightly less cautious is to trade when the EMAs are not clearly trending or when the actual is not between the EMAs. This will give more trades but is more risky as you can be caught by a sideways market or a reversal.
The following 1 min chart illustrates a typical trading session using these methods.
 |
‘Walks with Wolves’
For the higher risk trader you can consider trading against the trend when there is a large divergence between the 10 period SMA and 30 period EMA. This is the ‘walking with wolves’ style referred to earlier. Looking at the above charts you should see that a wide divergence usually signifies a reversal of the short term direction. This should be used as an exit warning or trigger and can be used to enter an opposing trade. Care should be taken if using this point for a reverse trade entry as there is no clear stop (the SMA and EMA are diverged and have already made an opposing cross so cannot be used as a stop loss exit). Usual stop methods should be used.
Divergences Defined
Thank you goes to HelenQu for her work on this.
The question was asked ‘What exactly is a big divergence? ‘. Testing revealed the following divergence characteristics for the 10 period SMA and 30 period EMA.
Anything below 10 is quite normal and does not signify a change. Fifteen and above can be a strong sign of an approaching cross for the SMA and 30 period EMA. Divergences of 30 or greater are a good indicator of a possible trend change.
It should be remembered that the Moving Averages are lagging indicators and you should attempt to predict the next minute or two to get an anticipated value for the divergences. The divergence can be positive or negative depending on whether the SMA is above the 30 period EMA or below it.
If you are using Sierra charts you can set up a custom study to display the divergence in a bar format.
Trading Zones and Stake Sizing Relationship
The following illustrates the trade zones I use. These fall into 4 basics categories.
For a downward trending market
- Portion of chart above 60 period EMA
- Portion of chart between 60 period EMA and 30 period EMA
- Portion of chart between 30 period EMA and 10 period SMA
- Portion of chart below 10 period SMA
- Portion of chart below 60 period EMA
- Portion of chart between 60 period EMA and 30 period EMA
- Portion of chart between 30 period EMA and 10 period SMA
- Portion of chart above 10 period SMA
| Zone A | reduced stake size – cautious area – could be the start of a reversal in trend |
| Zone B | standard stake size – this is the preferred trading zone but the actual should usually turn before it gets into this zone |
| Zone C | reduced stake size – the primary trading zone – the closer the actual is to the 30 period EMA the better – the stake size can be increased to standard stake size if the actual is close to the 30 period EMA |
| Zone D | Watching for exits or possible small stake entry in opposite direction as per ‘walking with wolves’ depending upon divergence of SMA and 30 period EMA |
Summary and Notes
This method is a good method of getting prices which are biased in your favour. You are selling when the actual is moving up and buying when the actual is moving down. If you only enter trades when the MAs are close together on the 1 min chart you will also have a clearly defined stop loss point if the cross of the MAs occurs. You need to keep your eye on the 60 period EMA and watch for flat spells or reversals. If you use the wider divergence of the 10 period MA and 30 period EMA to time reversals there is also a strong possibility of getting into a reversal when it first occurs and when the movement is strong. As the safe option of only trading when the MAs are close to each other gives very good results the use of the wide divergence to get opposite entries should only be used when confidence has been gained used the cautious approach first. Once consistently profitable using the cautious approach then, and then only, consider walking with the wolves.
Patience pays when using this method. Wait until the setup is in your favour and the price is good. Stop loss without hesitation once the negative cross or your stop loss point is reached. Returns on trades vary considerably using this method. As little as a few points to 60 or 70 points. Each trade has to be traded on its own merits and an eye kept on the closing opportunity. Don’t panic if you close too early and the move continues, you will get another opportunity.
Remember to use stake sizing as appropriate when using this method ie. for a close stop you can use a bigger stake and for a far stop you should use a smaller stake. For a wide divergence entry where you are expecting a reversal it would be usual to use a smaller stake.
It is sometimes possible to add to a position with this method. Once you have caught the initial move and if the expected reversals are not large then instead of closing and re-opening leave the original position open and add when you would have opened a new position. If the reversal continues then you have given away some or all of the gains from the first position but if the actual moves in the expected direction you will now have two profitable positions open and will be maximizing the gains from the first position.
Please note that this guide was written for my own use and for comment by others. It is not intended that any of the ideas presented here be used by anyone other than myself. Should you wish to use any of this material as a basis for your own trading method then you do so at your own risk.


Join the discussion