Trading Psychological Levels
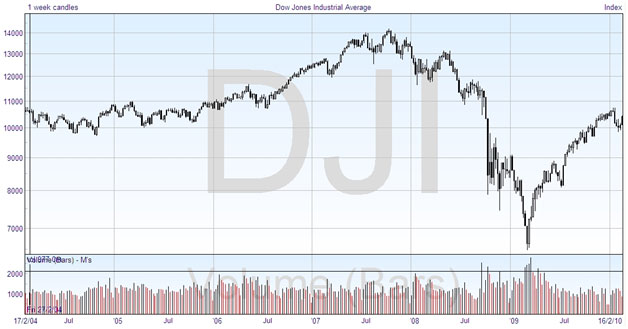
It’s sometimes surprising to see how the charts perform, and how much human psychology is intertwined with what might be regarded as more of a mechanistic value. Take for example trading the indices, whether the FTSE 100 or the Dow, which is made up of 30 companies. Despite the fact that the actual values are made up of an assembly of different share prices, with different weightings, the indices frequently exhibit a life of their own, and tend to use round numbers as support or resistance levels. Here’s an example with the Dow -:
 |
Levels that are particularly significant are the ‘thousands’, and you can see that the 10000 level was a significant support in 2005, with 11000 providing the resistance. In fact, each of the horizontal lines is placed at a whole thousand level, and you can clearly see that the price tends to bounce between them, at its peak in 2007 going between 13000 and 14000 several times. The key market levels which traders should currently be watching are 5,000 on the FTSE and 10,000 on the Dow. Both represent key psychological levels for the market and a clear below could imply a big move on the downside.
In technical analysis one of the challenges is to trade what stocks and other financial securities actually do, rather than what we think they should do, and that requires true observation of the price action, however much it seems strange that all the companies in the index would have their prices change in concert to reflect these whole number barriers. This is trading psychological levels, where the combined psychology of all traders together imposes an unexpected result on the overall chart.
This is a well observed phenomenon, and as such is not a temporary aberration but a solid principle that we can trade on. There are two ways in which you can adopt this principle into your trading. First, if you want to take a position in a trade, and are using a limit order to enter when the trade becomes viable, you should avoid placing it exactly on a round number, as there is the possibility that it may not be filled. For instance, if you believe the Dow is slowing as it approaches the 10000 level, as you can see on the right edge, and about to rebound, you need to place your entry higher than 10000 otherwise you may not be filled, and the index would rise without you.
A good way to trade these key resistance index levels is to sell short on a significant break below or to go long on a bounce with a tight stop loss. The alternative position is when you think that the level will be breached, suggesting a strong change in trend, but you want confirmation before getting into the trade. In this case, you should consider placing your order a set distance, perhaps 10 or 20 points, beyond the significant level. If the price just rebounds, using the level as support or resistance, then your order will never be reached and that saves you entering a losing trade. If you are correct that a strong change is occurring, and the price moves through the level sufficiently to trigger your order, then it is likely that it will continue moving in that direction, carrying your trade.
It may be even possible to hedge your spread betting position so as to cover both outcomes in one trade. For instance, if the FTSE falls to 5,000 you could consider buying at £5 a point with a stop loss just 10 points lower so as to profit from any rebound. A possible trading strategy would be to set the stop loss sell at, say, £20 a point. This would clear your long position if the market kept falling and put you in a net short ready to gain from a possible larger move lower.


Join the discussion