Reading the Spread
The chart below shows the Spread for three well-diversified but different stock lists over the same two-year time period. Compare the three Spreads.
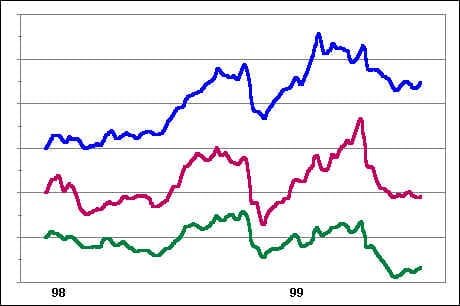
Each of these distinct universes of stocks produces a Spread with unique features.But their similarity, not their difference, is most telling.The fact that these three tend to rise and fall together demonstrates that each is influenced by an underlying and pervasive dynamic.
The rise and fall of the Spread detects and records the rise and fall of traders’ confidence in the trend.
Strength Following Markets
When traders are confident, they are willing to chase strong stocks into new high ground. Stocks which do not participate in the trend are ignored or sold, and the proceeds are used to purchase performing issues.As a result, strong stocks outdistance laggard stocks, and the Spread rises.
In truly bullish moves, three conditions are met: 1) RS leaders advance; 2) RS laggards advance, too; 3) RS leaders advance more strongly than RS laggards–the Spread rises.
Imagine a train.When all is well, power is supplied by the locomotive out in front. Although there is a tendency for the locomotive to separate from the caboose as couplings stretch, the caboose is nonetheless pulled along more or less apace with the locomotive.
In a bullish move, power is supplied by relative-strength leaders out in front.RS laggards are pulled along as well, though better performance is realized from RS leaders.
1992-93 Strength-Following Market
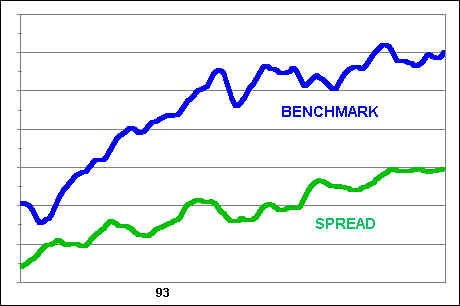
Rising markets accompanied by an expanding (rising) Spread produce very profitable strength-following markets. During these periods, traders’ confidence in the trend is high.
Contrarian Markets
On the other hand, when confidence in the trend weakens, profits are taken in stocks which have rallied well, and capital is redirected into sold-out “bargains”. As a result, laggard stocks outperform those which have been strong, and the Spread falls.
There is a relationship between the direction of the Spread and the trend of the overall market. During periods when the Spread is falling, the market may churn as leaders tumble and laggards begin to rally. This two-way affair often nets an overall flat, range-bound market. The 1994 market is typical.
1994 Contrarian Market
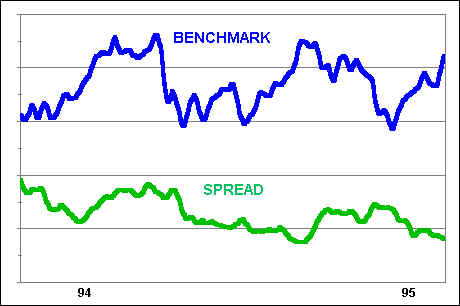
A falling Spread often produces a range-bound market
When the Spread falls, stock revert to the mean. Former leaders fall toward the benchmark while laggards rise. This process is a kind of tilling; the old RS leaders are turned under, and laggards seed a new crop of potential RS leaders, setting the stage for a new phase of strength-following.
Behavior of The Spread at Market Bottoms
At market bottoms, the Spread falls as laggard stocks which have become most deeply oversold rebound sharply.The 1987 bottom is a good example.
1987-88 Market Bottom
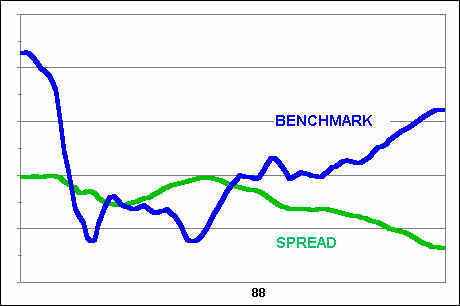
A falling Spread often marks the first rally phase off the bottom of bear markets
Once the market rallies convincingly from a bear market bottom, traders’ confidence in the trend returns.At that point, a falling Spread gives way to a rising Spread, and a new, usually very profitable, strength-following phase begins.
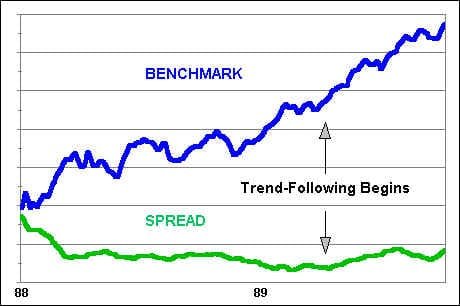
It was not until Spring of ’89, after the market had rallied well off the bottom, that traders’ confidence returned sufficiently to spark a new strength-following market
Behavior of The Spread at Market Tops
At market tops, sensitive RS leaders are often the first to round over as confidence in the trend begins to wane. As a result, the Spread may flatten out or decline even as the market continues to climb during the final stage of a bull market.The divergence between the benchmark and the Spread may begin as much as six months before the market begins to decline.
1987 Market Top
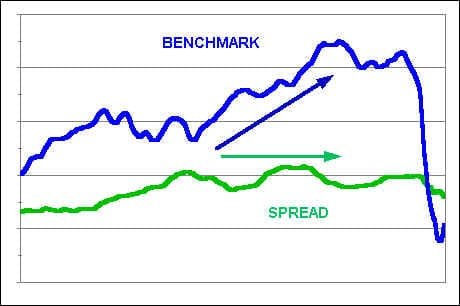
Waning confidence in the trend is registered by a flat-to-negative Spread as the 1987 market surges to a top


Join the discussion