Stocks and Bonds
Equity Market Tops: The Bond/Stock 6-Month Lag
Each equity market cycle is both broadly similar and exceptionally unique. There are repeating patterns, however, which may be relied upon. In cycle after cycle, a ‘bubble’ top is created when the equity markets rise after the bond market turns down. The longer this divergence continues, the greater the risk of a decline in equities, and the higher the equity market moves during this period of divergence, the larger the eventual market decline.
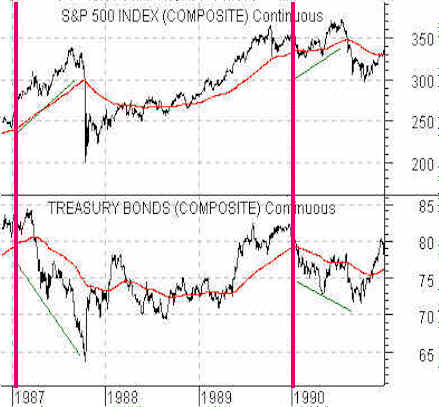
To demonstrate the impact of one such a divergence, I have included a comparative chart of the U.S. T-Bond futures and the S&P 500 Index futures for the 1987-90 period.

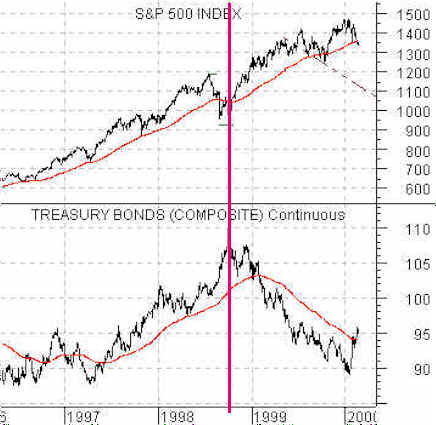
Consider the equity market action into the fall of 1998 (below). Bond prices had been rising for most of that year. As the pressure began to build on the currencies of several SE Asian countries (Singapore, Thailand, Indonesia, Malaysia, and The Philippines), liquidity flows toward the U.S. pushed bond prices to new highs. There is a divergence that developes between bond and stock prices at an important top: we expect bond prices to decline as equities move to new highs. So when the equity markets buckled as bonds rose, we knew that stock prices had not yet topped and were likely to push higher, even if bond prices declined. The correction in equities during the fall of ’98 was simply a buying opportunity–no matter how dire the outlook appeared at that time.

During a disinflationary cycle, as bond prices rise and rates fall, all declines in the equity markets are buying opportunities. When the bond market peaks and turns down, the equity markets tend to accelerate higher and usually provide the best gains of the entire cycle over the next six months. The real risk begins to build 5-7 months after the bond markets peak.
I don’t, by the way, just use the bond market for this analysis. I cross-reference the bond market peak with the utility indices (both the Dow Jones Utility Index and Philadelphia Utility Index) for confirmation. The key point is this: once bond prices begin to fall in earnest, the equity markets tend to rise briskly for six months to a top, and then correct lower.
Bonds and Equities Bottom Together
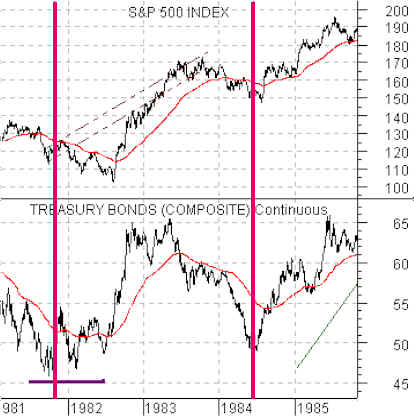
It is generally thought that the bond market gets a ‘flight to quality’ boost any time the equity markets get into serious trouble, creating the impression that these two markets work in opposite directions. Not true. Bonds and stocks bottom together. Using the T-Bond futures and the S&P 500 Index once again, we showcase the 1981-85 time period to make this point.

When examining the comparative chart, it is obvious that the bond and equity markets bottomed together in 1984. But in 1981 the relationship is not as clear. The equity markets did bottom in late 1981, even though prices went lower into the late summer of the next year. It took nearly a full year for stock and bond markets to form bottoms because of the serious economic recession at the time. But once that passed, the normal precision in the relationship of bonds and stocks was reasserted.
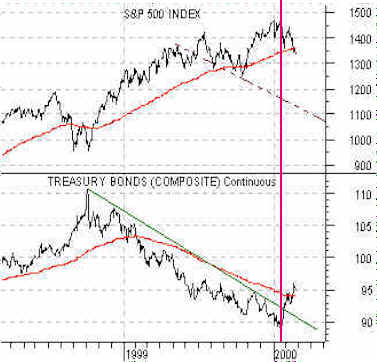
In the current market, the sharp increase in bond prices from the beginning of 2000 is a clear divergence, indicating that a bottom has not yet been seen in either stocks or bonds (see chart below). In due course bond prices will test if not exceed their lows. To end the cycle, bond prices will have to wash out along with equity prices.


Join the discussion