Trendline Triggers
Buying Bottoms
How does the perfect bottom form? Here’s what to look for:
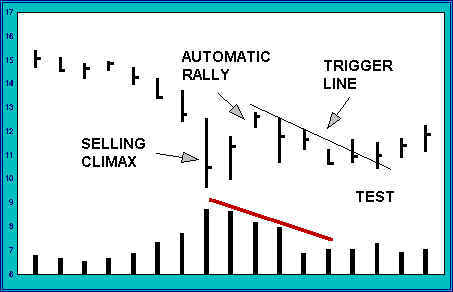
1) Selling Climax After a prolonged downtrend, downside price movement accelerates and volume expands significantly. Daily spread from high to low widens. The period of heaviest volume produces an extreme low.
2) Automatic rally After a selling climax, the market mounts a sharp snap-back rally. This rally is often characterized by falling open interest (in commodities) and narrowing price spread. The rally often violates a significant downtrend.
3) Test of the Lows The automatic rally rolls over and moves back toward the low. At the point the rally turns over it is difficult to tell if a) the low will hold (producing a successful test) or if b) the broader downtrend will reassert itself and push the market to new lows. As the market moves back toward the lows, clues as to the market’s ability to hold can be found in the amount of volume, the slope of the decline and the width of daily price spreads as the market approaches the old low. A decline on low volume and narrow daily price ranges indicates that the test may be successful. In other words, the decline is gentle. The selling is not as forceful or as committed as the selling that brought the market to the low of the climax.
4) Sign of Strength After a successful test, the market stages a multi-period rally in a sign of strength. The sign of strength is the market’s way of telling the world that the selling pressure is off and that it is free to rally.
The general consequence of this sequence is a change in trend or, at least, a strong counter-trend reaction. A counter trend reaction often resolves into a trading range.
This sequence repeats itself endlessly as large operators (strong hands) complete selling campaigns and small traders take poorly informed market positions. The sequence can be found in both short term (one minute charts) and long term (monthly and yearly) charts.

Market tops and bottoms are usually formed in sequence. A classic bottom exhibits the following elements: 1) Preliminary Demand, 2) Selling climax, 3) Automatic Rally, 4) Secondary Test, 5) Sign of Strength.
Entry Triggers
After a market has gone through a climax, automatic rally and test, price-volume action may indicate a buying trigger. Potential triggers include key reversals, upthrusts, springs, and trendline breakouts.
I like using triggers because
- Triggers combine the best aspects of systematic and discretionary trading.
- Entering on a trigger may modestly reduce the profitability of many trades, but it also drastically reduces the number of premature entries.
- Buying into a market decline or selling into a rally is counter intuitive and contrary to most conventional trading wisdom. Triggering in makes difficult decisions much easier.
- Trading triggers bring discipline to entries and stops.
Different triggers work better in different situations, so familiarity and practice with various triggers is essential. With time and practice you will develop mastery over a small number of triggers which work for you.
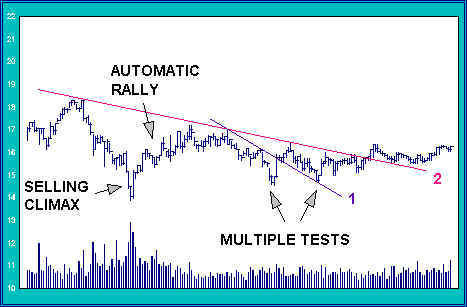
One trigger I rely on in my trading is the trendline trigger. A potential trendline trigger is formed when a clearly evident trendline forms along descending highs as the market moves into a test zone. In the chart below there is a daily downtrend line (line #1 in blue) that can be drawn along the highs of price action from the high at 17. A daily close above this downtrend strongly suggests that the low has been successfully tested.

The market retests the low again above trigger line #1, setting up a second trigger of the more conservative line #2 (shown in red).
Steep trigger lines, running across relatively few bars, tend to produce whipsaws, but the distance to a protective stop is usually small. In the chart above, the first trigger is followed by a whipsaw to a second test of the low. The shallow trigger line (#2), is a more conservative entry trigger. This trigger provides a backup entry if other, more aggressive triggers are either stopped out or missed by the trader.

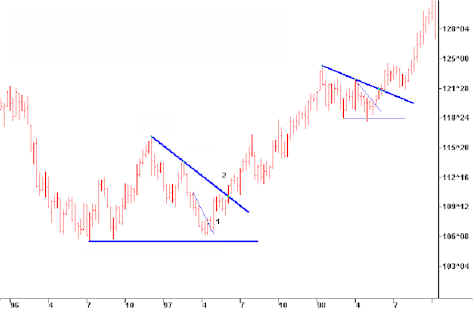
Trendline triggers develop not only at bottoms, but as price moves out of consolidation zones as price rallies. The same sequence from climax to test sets up the trendline trigger.
Entry on a trendline trigger takes advantage of two very reliable patterns (climax/test and trendline break). This trigger can be used on any chart perspective, from one minute to monthly, and across a wide variety of markets. The trigger works extremely well on hourly charts, but I also often find myself triggering in on daily and weekly trades.
Selling Tops
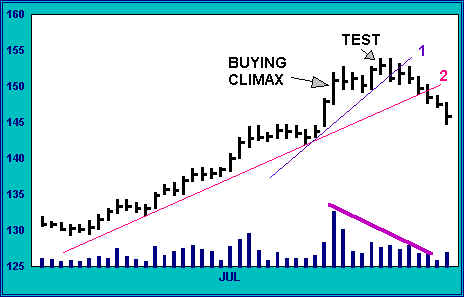
For a sell, the setup is formed when the market makes a well defined high, reacts lower and later tests the high. As the market rallies back toward the prior high a trendline is drawn at periodic lows along the rally. The entry is triggered when the market falls through the trendline after testing the prior high. A test should come close (within a few ticks) or modestly exceed the prior high (a test which manages a new high is an upthrust, or shakeout).

The aggressive trader can sell the break of the trendline that runs along the individual bar lows of the rally from the reaction low (trigger line #1). The more conservative trader can wait to sell the break of a shallower trendline drawn across the lows of the longer-term rally (#2).


Join the discussion