The Chinese Yuan (CNY), officially called the Renminbi (RMB), remains a critical currency to monitor daily due to its importance in global trade and finance. While “Renminbi” refers to the official name of China’s currency, “Yuan” refers to the basic unit of that currency (e.g., a pizza might cost 10 Yuan, but not 10 Renminbi).
The ‘Dark’ Beginnings…
The Renminbi, which literately means ‘people’s money’, is the official currency of the People’s Republic of China (PRC). It was first issued on December 1st, 1948 by the PBoC, Public’s Bank of China, the country’s central bank. The bank was established on the same date under the Chinese Communist Party ruled by the Chairman Mao Zedong (also known as the founding father of the PRC). China experienced a massive monetary inflation between 1937 and 1945 (end of WWII) in order to fund the war with Japan. Studies showed that between 70 and 80 percent of the annual expenditures were covered by fresh printed money during that period. Therefore, the country suffered from a Great Inflation in the same years that was reflected on the exchange rate. Here are some figures (coming from the work of Richard M. Ebeling, the Great Chinese Inflation, 2010):
- In June 1937, one US dollar was traded at 3.41 against the Yuan
- By December 1961, the exchange rate of USDCNY rose to 18.93 in the black market
- At the end of WWII, the Yuan depreciated dramatically to 1,222 (vs. the greenback)
- In May 1949, USDCNY reached a dramatic 23,280,000
In the 1950s, the Chinese economy was so cut off from the rest of the world that it is difficult to find data on a potential meaningful exchange rate. All the information we have so far is that a second issuance of Renminbi took place in 1955 and replaced the first one at a rate of one new CNY to 10,000 old CNY.
The World Bank published an annual average middle exchange rate for US Dollar to Chinese Yuan since 1960. Between 1960 and 1971, one US dollar was worth 2.4618 Chinese Yuan, which makes me believe that China was ‘also part of’ the Bretton Woods agreements (we are speculating on that information based on the ‘pegged’ exchange rate). Then, after the Nixon ‘shock’, the exchange rate started to depreciate and reached a low of 1.8578 in 1977 before starting to soar to 2.40 in 1980.
The 1980s reform and RMB Devaluation:
With China’s economic reform in the 1980s, the Yuan started to become a more easily traded currency (exchange rate was therefore more realistic), thus data became public. The following historical exchange rates are based on Bloomberg (ticker: CNY BGN Curncy).
Starting with a grossly overvalued exchange rate in 1980, the Chinese Yuan experience a series of devaluation until the late 1990s until the Chinese authority settled the rate 8.27 CNY/USD.
As you can see it on chart 1, the rise of the US Dollar under the Reagan Administration (as a consequence of the Fed rising interest rate to 20% to counter inflation coming from the second oil shock) pushed the USDCNY exchange rate from 1.65 to roughly 3.00 in September 1985 (before the Plaza Accord on September 22nd). In contrast, the real exchange rate was more much stable and remained virtually constant between 1981 and 1985 (during this period, the Renminbi was pegged to a back a basket of internationally traded currencies weighted according to their importance of China’s trade).
Between 1987 and the end of 1990, the Chinese Yuan was relatively pegged to the US Dollar, with a 26% Yuan devaluation that took place in the last quarter of 1989. However, these devaluations were not sufficient with the emergence of a black market pricing a much higher USDCNY exchange rate (i.e. cheaper Yuan currency against the US Dollar). Therefore, the ‘unofficial’ floating rate (a swap market rate) has constantly driven the ‘official’ rate (nominal rate on chart 1) until the massive devaluation of 1994 (and the official and ‘unofficial’ rates were eventually unified).
1995: The start of a new regime
One the two rates were unified, the Chinese currency was pegged to the US Dollar from 1995 to 2005 at an exchange rate of 8.28 Yuan per US Dollar. Therefore, the PBoC was ready to intervene (i.e. buy or sell Yuan) in the market to keep that rate steady. This policy was combined with a policy of restricting international capital flows, where the citizens were not allowed to convert savings into US dollars, Japanese Yen or British pound.
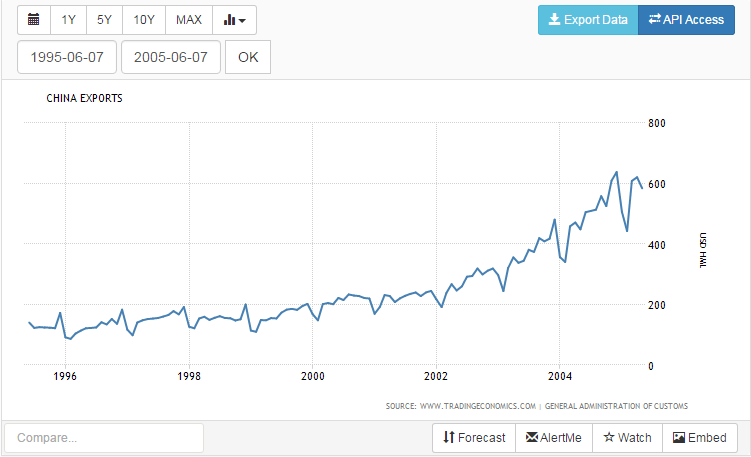
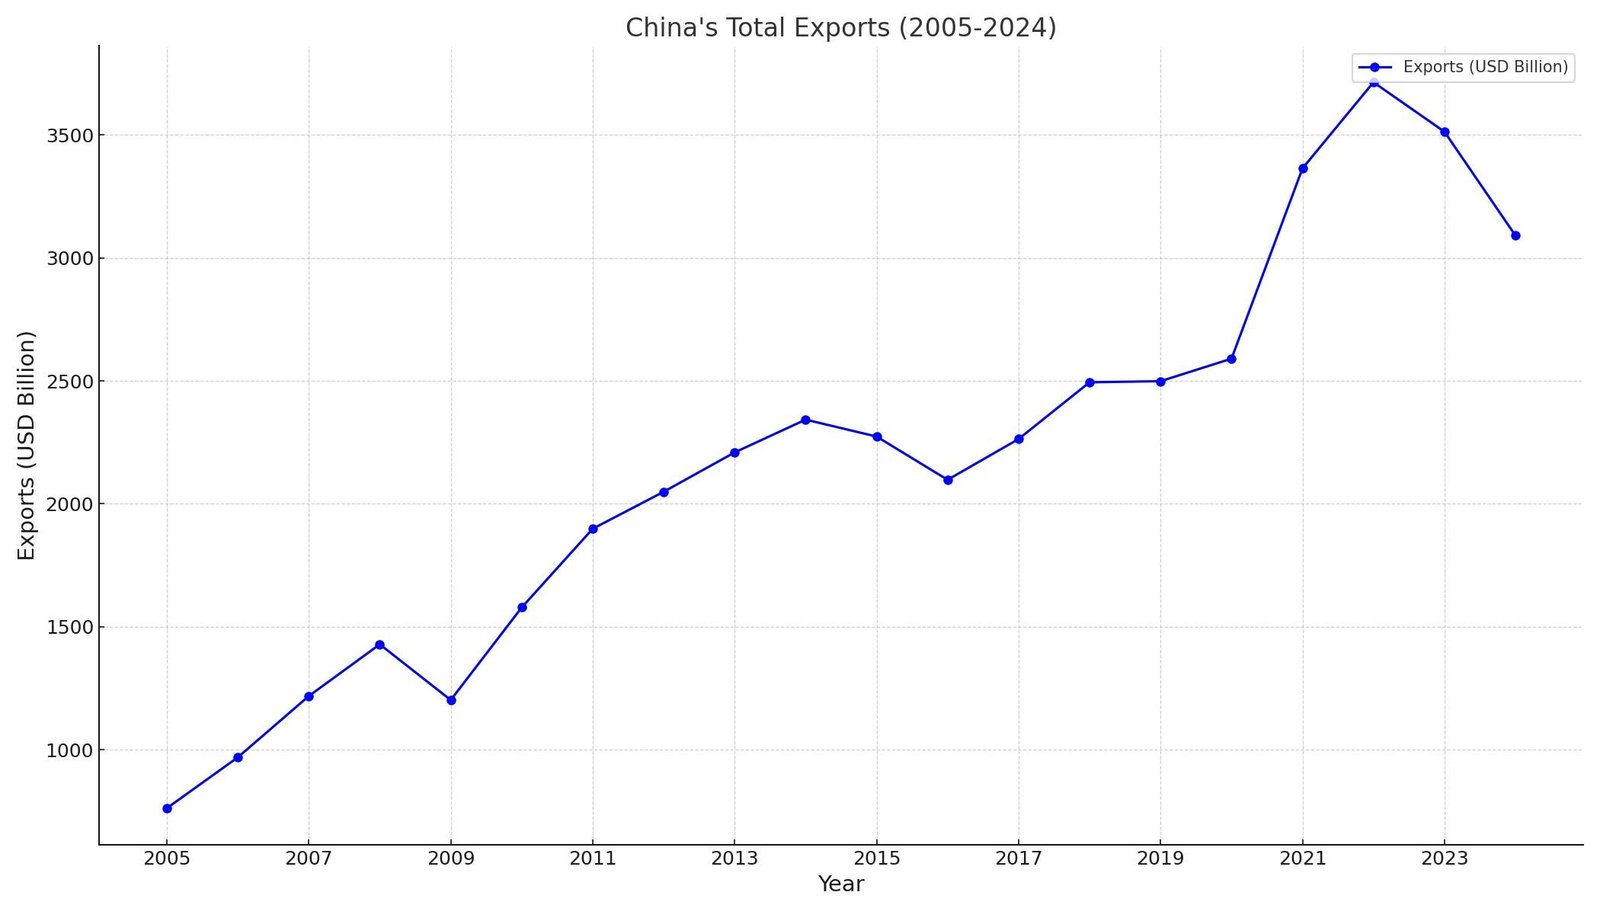
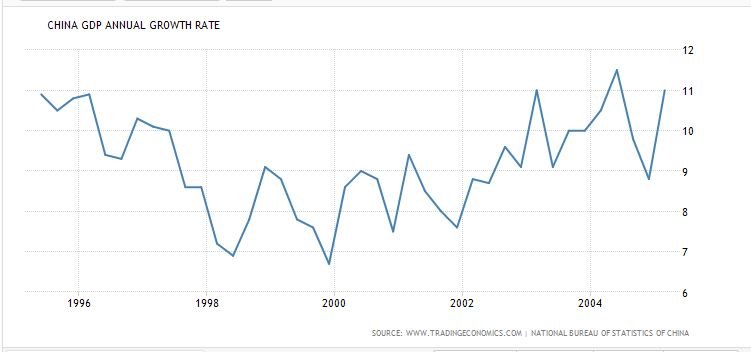
In consequence, the low exchange rate lead to political issues between US and China as many studies concluded that the Chinese Yuan was an undervalued currency. Exports were growing dramatically in China (see appendix 1), from 160 million US dollars in 1995 to 600 million dollars in 2005 according to the General Administration of Customs. The economic modernization, cheap labour costs in addition to a more ‘transparent’ exchange rate led to a surge in Foreign Direct Investment during the 1990s and 2000s. The economy average an average annual growth rate of 9-10% between 1995 and 2005 (appendix 2).
China’s economic growth and trade liberalization led to a sharp expansion in US/China commercial ties, and a constantly increasing US trade deficit with China. If we look at table 1, the US trade balance deficit widened from USD 10.4bn to USD 201.6bn in 2005, damaging the US economy. There are many reasons why China could have resisted from international pressures to maintain it peg during that period, but the two main ones that come to our mind is that China was mostly financing the US deficit (i.e. purchasing US Treasuries) and the US manufacturing was benefiting from cheap labour costs for goods produced in China.
The 2005 peg removal
Eventually, the PBoC removed the peg on July 21st 2005 and allowed a first one time appreciation of 2.1%, pushing the dollar down to 8.11 CNY. From there, China allowed its currency to float within a range determined in a relation to a basket of currencies (authorities told the world that it ran a ‘managed floating exchange rate regime based on market supply and demand with reference to a basket of currencies’). The basked was dominated by its main trading partners – US Dollar, Euro, Japanese Yen and South Korean Won – with a smaller proportion of other currencies (GBP, AUD, RUB, CAD, THB and SGD). Until Q3 2008, USDCNY fell roughly 18% before the reintroduction of a de facto peg during the financial crisis from 2008 to mid-2010 at around 6.80 Yuan per dollar.
June 2010: A return to the daily trading band limit:
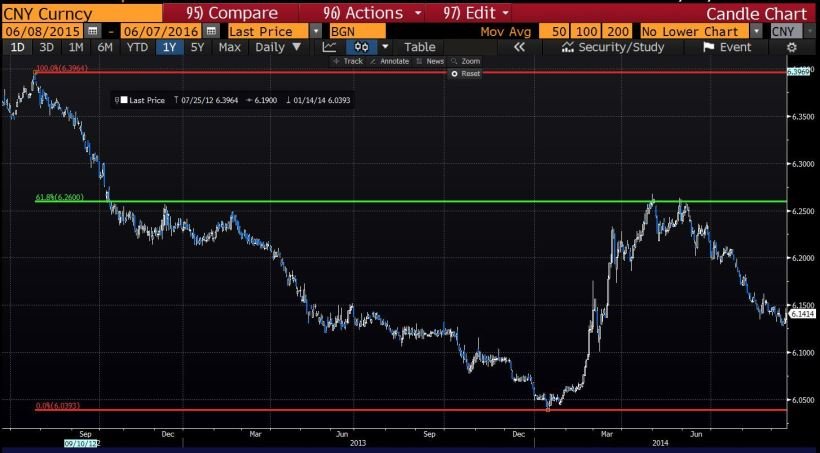
In June 2010, after a two-year peg, China allowed once again USDCNY to trade within a 0.5% band (daily limit for appreciation or depreciation of the CNY against the USD) amidst major pressure from international trade partners. The Yuan’s trading band was then widened to 1 percent in April 2012, which led to further appreciation of CNY (USDCNY fell another 11.60% to reach a low of 6.01 in January 2014).
The Yuan Crisis in Q1 2014
In the start of 2014, we saw a little Yuan crisis with USDCNY erasing most of its Jun-2012 / Jan-2014 fall (62% roughly if we look at chart 2). There are many stories that could describe this sudden CNY collapse:
- the PBoC willingness to join the global currency war and enhance export
- the carry trade unwinds from structured products build on the hypothesis that the Yuan will appreciate continuously (FX Target Redemption Forward story for instance)
- other thought that the PBoC was paving ‘the way for further liberalization of the Yuan exchange rate’
We think the carry trade unwinds is the most appropriate based on the one-way market positioning concerning the Yuan before that crisis. Products were structured by banks on the hypothesis that the Chinese Yuan will constantly rise against the USD until it eventually reached its ‘fair value’ which was estimated between 5 and 5.5 at that time (BEER, FEER fair value models). We know that carry trade currencies tend to depreciate gradually during some period so that carry traders could benefit from the interest rate differentials, however the risk-off aversion (i.e. carry unwind) is sudden and very drastic.
In mid-March 2014, the PBoC widened the range to 2 percent (allowing the exchange rate to rise or fall 2 percent from a daily midpoint rate that the central bank sets each morning). Until the August 11 devaluation that occurred the following year, the Chinese Yuan oscillated at around 6.20 against the Dollar.
August Devaluation
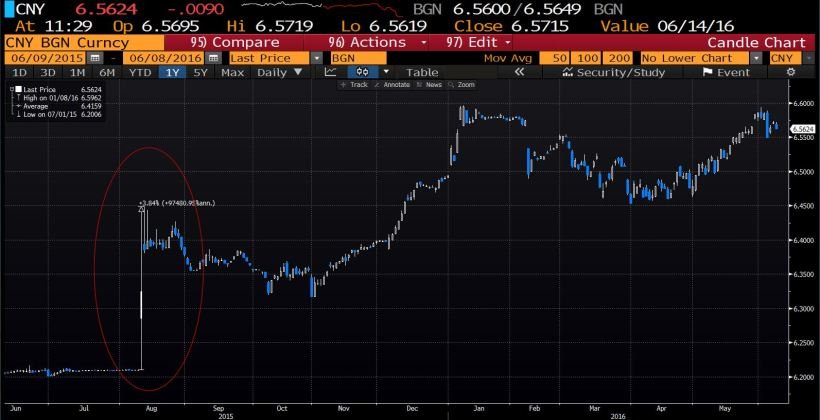
On August 11th, the PBoC suddenly allowed the Yuan to depreciate by nearly 2% against the USD, its largest devaluation in the past two decades amid slower economic growth and a depressed highly-volatile stock market. As you can see it on Chart 3, the Shanghai Shenzhen Index (CSI 300) started to enter into a bear market in June 2015 after it reached a high of 5,380. In the beginning of August 2015, the market was almost down 2,000 pts. and the fear of a ‘Chinese bubble collapse’ raised concerns over global investors. A second PBoC move was done the consecutive day and pushed the total devaluation to nearly 4 percent (from 6.21 to 6.44 USDCNY, see chart 4).
Key Observations:
- 2005-2008: Exports grew robustly, nearly doubling from $762.0 billion in 2005 to $1,428.5 billion in 2008.
- 2009: A decline to $1,202.0 billion occurred, reflecting the global financial crisis’s impact.
- 2010-2014: Recovery and growth resumed, with exports reaching $2,342.3 billion in 2014.
- 2015-2016: A slight downturn was observed, with exports decreasing to $2,097.6 billion in 2016.
- 2017-2019: Steady growth returned, culminating in $2,498.6 billion in 2019.
- 2020: Despite the pandemic, exports rose to $2,590.2 billion.
- 2021-2022: Significant increases were noted, with exports peaking at $3,714.3 billion in 2022.
- 2023: A decline to $3,513.2 billion occurred, a 5.5% decrease from 2022.
- 2024: As of October, exports totaled $3,091.0 billion, indicating a potential year-end decrease compared to 2023.
These figures illustrate China’s dynamic export performance over the past two decades, influenced by global economic conditions, trade policies, and domestic factors.
Key Observations:
- 1995-2007: China experienced rapid economic growth, with GDP growth rates consistently above 9%, peaking at 14.23% in 2007.
- 2008-2009: The global financial crisis led to a slowdown, with growth rates declining to around 9.65% in 2008 and 9.40% in 2009.
- 2010-2019: A gradual deceleration occurred, with growth rates decreasing from 10.64% in 2010 to 5.95% in 2019, reflecting structural adjustments and a shift towards sustainable growth.
- 2020: The COVID-19 pandemic significantly impacted the economy, resulting in a growth rate of 2.24%.
- 2021: A strong rebound occurred with an 8.45% growth rate, driven by recovery efforts and government stimulus.
- 2022: Growth slowed to 2.99%, influenced by factors such as a property sector downturn and global economic uncertainties.
- 2023: The economy expanded by 5.20%, surpassing the government’s target of around 5%.
- 2024: As of the third quarter, the GDP growth rate stands at 4.60%, indicating a slight deceleration.
These figures highlight China’s economic resilience amid challenges like the pandemic and global market fluctuations. The data up to the third quarter of 2024 suggests a continued, albeit moderated, growth trajectory.
Watch the CNY – CNH spread
As China has been opening up its economy to the RoW (Rest of the World) since the late 2000s, the officials’ goal was to internationalize its currency to the market to settle trade and financial transactions. As you know, the CNY – or on-shore Yuan – is not allowed outside of China and is only convertible in the current account (i.e. trade) and not in the capital account (i.e. for investments and banking flows). Thus was born the CNH in 2009 – offshore Renminbi – which circulates in offshore markets such as Hong Kong (China Mainland Hub). Since then, there has been a rapid expansion of offshore clearing centres in financial cities like London or Frankfurt and the RMB has begun direct currency trading against the Euro, GBP, NZD in addition to USD, JPY or AUD.
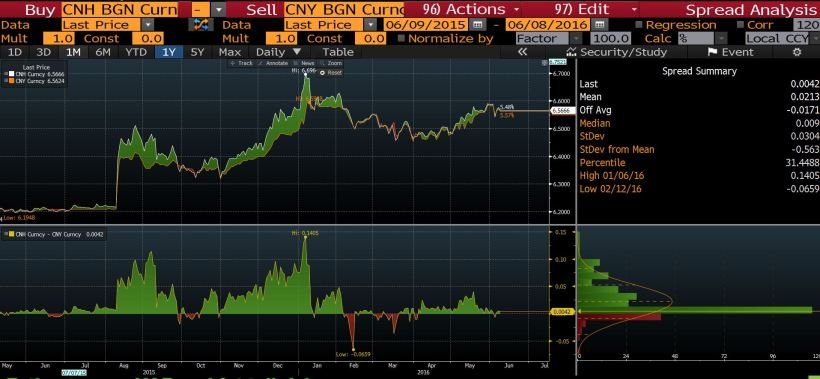
The important criteria of the CNH is that it is allowed to float freely with no restrictions on cross border trade settlements, therefore we usually like to watch the CNY – CNH spread just to see the divergence sometimes that happens in the market (See chart 5). In the beginning of the year 2016, we saw a massive divergence between USDCNY and USDCNH, with the offshore Yuan (CNH) was depreciating at a much faster pace than the on-shore Yuan (CNY). On January 6th, the spread reached 14 figures, with USDCNY trading at 6.55 and USDCNH at 6.69. Eventually, the situation stabilized and the two exchange rates converged.
We think that by looking at the spread between the two rates, you can gauge the market’s perception toward the currency and its confidence in the PBoC’s policies.
2016–2023: The Yuan’s Internationalization
The Yuan’s path to internationalization accelerated with the introduction of the offshore Yuan (CNH) in 2009, traded in financial hubs like Hong Kong and London. While the CNY (onshore Yuan) is tightly controlled, CNH trades more freely, reflecting market sentiment.
Key milestones include:
- 2016: The Yuan was included in the IMF’s Special Drawing Rights (SDR) basket, solidifying its status as a global reserve currency.
- 2018–2020: The US-China trade war led to a weakening Yuan, with USD/CNY crossing the psychological barrier of 7 for the first time in over a decade.
- 2020–2023: The Yuan remained under pressure due to China’s slower post-COVID recovery, domestic property market issues, and geopolitical tensions.
2024 and Beyond: Key Trends to Watch
- China’s Economic Transition:
The property market crisis and high corporate debt continue to weigh on China’s growth. A slower economy increases pressure on the Yuan, with USD/CNY hovering around 7.30 in late 2024. - Central Bank Policy:
The PBoC has maintained a “managed float” regime, occasionally intervening to stabilize the Yuan. Recent trends suggest continued efforts to support growth through looser monetary policy. - Geopolitical Factors:
US-China relations and potential decoupling efforts from Western nations remain significant risks. - Yuan’s Role in De-Dollarization:
Efforts to reduce reliance on the US Dollar have gained momentum. China has promoted Yuan-denominated trade settlements, particularly with countries in the Global South.
Mixed Future for the Yuan
As China grapples with domestic challenges and global shifts, the Yuan remains a focal point for investors. While short-term depreciation pressures persist, long-term trends, such as increased internationalization and its role in de-dollarization, suggest a complex but evolving future for the currency.


