Spread Betting Strategy 1 – Trading With The Trend
There are several entry methods you can use after you have identified a trend:
- Enter when the market is making a new high (for uptrends) or a new low (in downtrends). You can enter on a buy-stop (or sell-stop) order which you can place well beforehand, having your protective stop ready and waiting to be entered. One advantage is: If the market does not reach that high and turns around, you are safe as your buy-stop is not filled. The drawback to this is very often, the market will go through your stop, and then turn back, giving you an instant paper loss. To handle this, you need to place your protective stop well away from the market. But if you do take a loss, it will be a sizable one.
- The better method, which I recommend, is to wait for the market to make a new high (or low) and then wait for a pull-back to enter.
- This is called ‘Buying on the dips’. Then, your stop need not be so far away and any loss would be manageable. You can time your entry with a simple indicator, such as Momentum Oscillator (more later). The drawback is that the market may not pull back to your planned entry price and will take off without you. Those are the breaks! But remember – if you miss this bus, there will be another one along.
OK, so you have a position in a trending market and making gains (on paper only!) with your original protective stop in place. How and when should you move your stop closer to the market?
Moving Your Protect Profit Stop In A Trending Market
Let’s say you are in a rising (bull) market and it is making new highs. Your paper profit is considerable. Initially, you could move up your stop to protect around 30% of your gain. If you are long Gold at $1,050 (your stop is at $1020) and the market is now $1 090, your gain is $40, or £400 per £1 bet. I would suggest moving up your stop to capture £120 profit at least, which means moving stop up to $1,062. You should not move it too close – you need to give the market some room – it’s a rather subjective call, but you can base it on a recent low.
You keep moving up your stop as the market makes new highs until you are taken out. You need to adjust daily when the market is moving fast. There are no hard and fast rules that apply here.
A Market Gem: Trends Stop When They Stop
Of course, trends never go on forever. Eventually, prices become unsupportable by the ‘fundamentals’ (remember Crude Oil hitting $147/bbl in the summer of 2008?). That is another problem with trends. But if you can jump aboard a good trend fairly early, and keep adjusting stops, you can take a big bite out of the move.
Very often, a glance at a chart can tell instantly whether there is a good trend or not (a succession of higher lows and higher highs).
Sometimes, you can use Fibonacci retracements and projections (more later) to time an exit. This is a very powerful tool.
When Bad Things Happen To Good Trend Followers
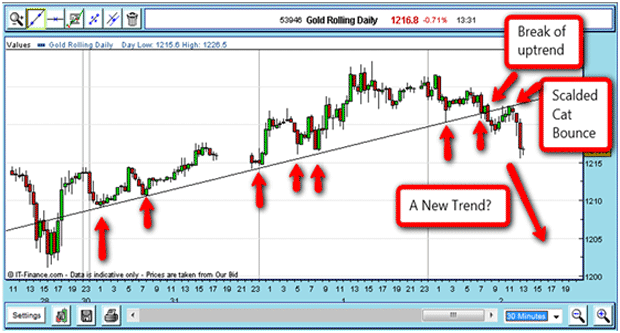
At some point, any trend will come to an end. How can we tell when a trend has ended? One very good clue is when the trendline is broken. Take a look at this chart of Gold (I have just taken this off my screen in real-time):

The uptrend has been clearly broken after seven touch points to the uptrend line (the more touch points, the more reliable is the trend line). But note that the market has rallied to the underside exactly and then bounced off. What was once support (the line) is now resistance! The market character has changed (usually there is no ‘news’ to act as trigger).
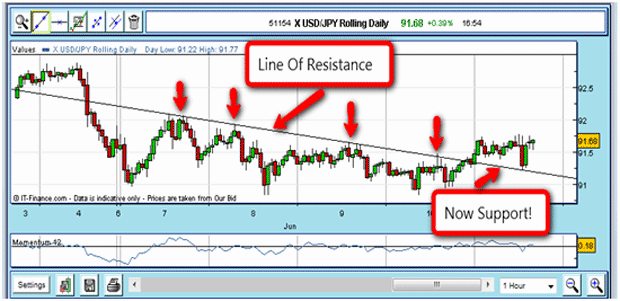
Here is another wonderful example in the USD/Yen:

Note the strong downtrend line with 4 major touching points, but after that, the market thrusts up through the line, runs back down and then recoils like that scalded cat. This tendency – to punch through resistance (or support) and then move back to the line before resuming the new trend – is very common in all time frames.
I am constantly searching the charts for these situations – they offer a low-risk entry point with high confidence you are trading in the correct direction. You should be able to spot many such set-ups per week, especially in shorter time-frames. They will give you many profitable trades. So get searching!
In fact, if you wanted to keep it really simple, you could base all your trading around these situations. You could do a lot worse!
Here is an exercise for you: Go through some charts in many timeframes and spot the trending markets with lots of touch points. On most spread betting platforms, there is a simple straight line generator, so you can throw that old school ruler away! Then see what happens when the trendline is broken. How often does the market come back to the other side of the line, and then bounce off like a scalded cat? I think you will be surprised how often this happens. The trend line acts like a magnet – reversing poles at the breaks.
Of course, it would be wonderful if the real world were that certain! Sometimes, the markets will reverse right back through the trendline and continue on its merry way – but that is what stops are for. They keep you out of trouble if you are wrong.
Time To Check What Kind Of Trading Strategy Is Right For You
You may like the idea of trend-following, and if so, you are probably quite conservative, and feel uncomfortable with unconventional views. You like to get involved with others, and you do not consider yourself a ‘maverick’. You generally ‘go with the flow’.
On the other hand, if you are unconventional, hold fairly radical views, like to step away from the crowd, then this method may not be for you. You may be more comfortable with the next strategy – looking for trend changes (turning points).
Of course, if you are a fairly well-balanced person, you can use both strategies in your trading. I know I do.
Are there any other tools we can use to use to help us get in early on a new trend? This is where technical analysis comes in.
Technical Indicators
There are many indicators that help you assess the internal strength or weakness of a market. This kind of information is invaluable, especially for short-term trading, and for trading near turning-points. Your spread trading platform will give you access to many, including Moving Averages, MACD, RSI, Stochastic, Williams %R, Momentum, Volatility, and so on. There are many guides available that can tell you how to use them and what they are for – and most spread betting providers will have this information.
One of my favourites is the simple Momentum Oscillator/Indicator (available in most trading packages). It is the arithmetic difference between the closing price of the last bar (of any time-frame) and the close ‘n’ periods ago (you can choose the value of ‘n’, but the default value for many trading platforms is 12 periods). It is a measure of changes in the trend, and can be applied on 1-minute charts up to monthly.
A Top Tip – Using Divergences To Spot Trend Reversals
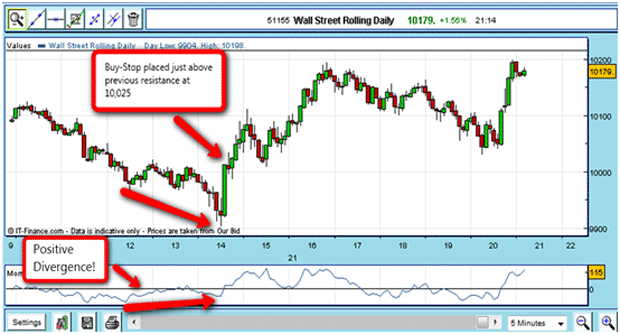
One way I use it is to search for a divergence with price. Take a look at this 5-minute chart of the Dow Jones. As the market is moving lower, the Momentum isn’t following it into new low ground – a sign of weakening bearishness. That is a positive divergence, and tells me that the conviction of the market for lower prices is growing weaker. (There are more good examples I show on my blog). Many market reversals are accompanied by this kind of divergence. Here is a good example:

If you are a novice trader, I do strongly advise keeping things as simple as you can with technical indicators. It is so tempting to fall in love with the technology and ‘tweak’ a basic system and before you know it, it is so complicated that you can’t see the woods for the trees. I have found that when I use just a few simple tools such as I describe, and a trading situation jumps off the chart at me, I have much more success.
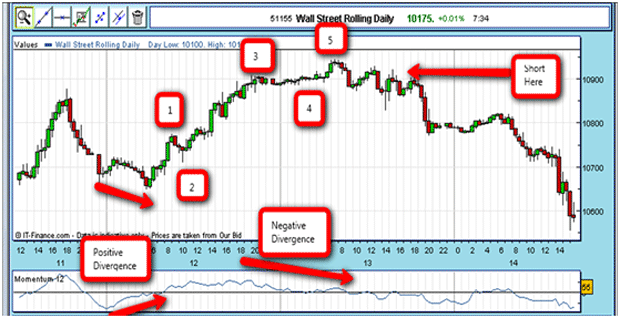
And this is how this trade worked out:

After a nice 5 waves up accompanied by a Negative Divergence, a short trade was indicated for another nice gain.
Trading Software
There are many vendors of trading systems out there, all anxious to sell you their fantastic mega-profit making software. By all means, if you have the funds, give some a go. Most of them are very expensive, and unless you have a large trading account, their cost will outweigh any likely profits. They are usually incredibly complicated and require many weeks/months of study to learn.
But I am aiming this book at more frugal traders who wish to develop their own strategies using the free tools that come with all spread betting platforms – and the guidelines you will find here. This may come as bad news for software junkies!


Join the discussion