Signals
The first signal that you should look for is the lagging line crossing the cloud, as this will confirm the change of trend. Usually the price will already have started in the countertrend, but using the lagging line instead has the advantage that the signal is more likely to be correct than acting on a price crossing. In the chart shown above, there are a couple of touches which just break the line, but the definite crossing is in December — this would be drawn in January, when the price drops, and it provides confirmation of the downtrend which follows.
You can see that the secondary indication of the price crossing the cloud occurs earlier, in December, but if you had traded then the modest upward correction would have taken you out with your stop loss, despite the fact that in this case the downtrend did resume. Nonetheless, some traders prefer to take the earlier signal and accept they will be stopped out of the position more often. It can help to look back at previous crossings to see if the price crossing has been reliable in the past.
One of the ideas of cloud charting is that the cloud may be both a support and resistance, and you should expect to see it tested by both the price and the lagging line. In this case, the price tested it from the underside after crossing and the resistance held. Curiously, the same price pattern when seen at the earlier time as the lagging line was testing the cloud as a support.
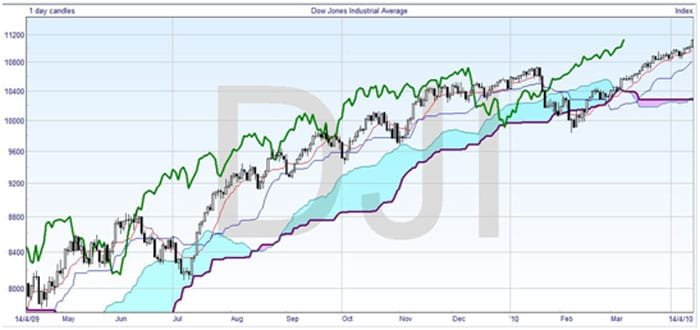
Here’s a chart of the Dow Jones Industrial Average, which has had a good run in the last few months.

It’s clearly in an uptrend, but the price tested the cloud’s resistance in July, the lagging line tested it again in December, and the price which made that lagging line touch, in February, followed the cloud edge before taking off again. Notice how the cloud, by projecting forward, gives us an idea of what the price needs to do to keep the trend in motion. In March the cloud to the edge of the chart was already drawn, and the steady climb of price since then has ensured that both price and lagging line are a long way from touching or crossing the cloud, meaning the uptrend is still very strong, and a reversal not indicated.
But hold on a second. Against that information, there is another signal on the chart from the cloud, and that is the change in color, which is actually caused by the Leading Span lines crossing. Although this is not generally used as a signal, with traders preferring sight of more conventional signals, it is a point worth noting. In this case, it looks as though this is a very weak crossing, perhaps even reverting at the edge of the chart to a bullish cloud again. You can see a similar sort of brief reversal in August, so it may be nothing. What this does illustrate is that a cloud chart can be used in several different ways to build a picture of the security.
The signals we have considered so far are the lagging line and the price line crossing or running along the cloud edge, and the cloud lines crossing. The last crossing to be considered is the turning line crossing the standard line. It’s interesting to note that some experts believe this is very important, and others take them off the chart to reduce the visual clutter. This is a true reflection of how young the study of Ichimoku charts is, and how the techniques of using them are still being developed.
As previously pointed out, these first two lines can be viewed as moving averages, so when the shorter period line (the turning line) crosses above, this is a bullish signal. One way to trade with them would be in an uptrend to buy when the turning line crosses above, and sell when it closes below. If you have a bearish trend, and are thinking of selling short, then you would take the position when the turning line crosses down through the standard line, and liquidate it when the turning line passed back up.
You can use them for countertrend trading, trying to get in early on a reversal, and this may work on the DJIA chart shown above soon. When the price has gone a long way from the cloud, an early signal may be the crossing of the turning and standard lines. As you can see, it will take a long time for the price to indicate a reversal, but the lines may cross much sooner and herald a trend change. They are already starting to come together at the right edge of the chart.
Finally, you could consider applying either line as you would a moving average, looking for the price crossing the line. Because of the short time span, you may find that the price crosses the turning line too often for worthwhile trading, in which case you can always look at the crossing of the standard line to see if that works for the security you are following.


Join the discussion