Pre-qualifying Patterns
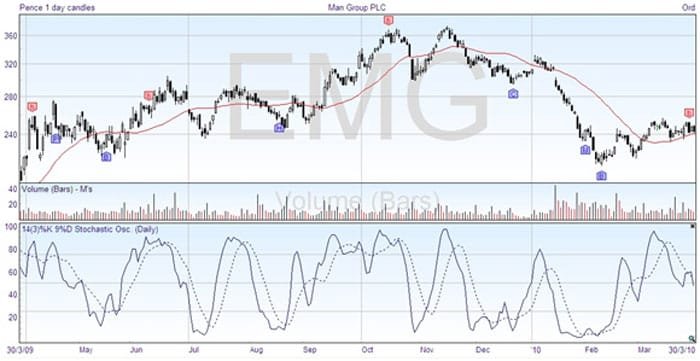
I mentioned that candlestick patterns should not be traded on in isolation, but in the context of the trend, the chart and the indicators. One way to incorporate this idea is to prequalify or filter on the basis of an oscillator paying attention to any appropriate candlestick patterns. Here’s the chart we’ve been using, where the software has identified some potential candlestick patterns –

It may be a little hard to read the details at this scale, but in general the blue arrows are bullish reversal patterns, and the red arrows are bearish patterns. They are labeled with letters of the alphabet to identify the pattern found.
The first arrow, a bearish red one, is confirmed by the price being in an uptrend and the Stochastic Oscillator showing overbought. The reversal happens, although it rapidly changes back to hit our trailing stop – you did remember to enter a stop, didn’t you? We can ignore the first blue bull arrow, as the oscillator is still high. Notice the price didn’t rise. The second blue has more success, and occurs when the indicator shows overbought, and the price is in a good downtrend, so would have been traded. The next arrow, in June, is red, the market is overbought, and the price is headed up. But it fails to reverse straight away and we would be stopped out of the position for a loss.
In August the next arrow, a blue bullish one, is confirmed by an oversold indicator, and does mark a reversal. At the peak, the red arrow, confirmed by an overbought indicator, marks the start of a downtrend. The next three are all blue bullish arrows arising in oversold conditions. They are all followed by the price trending upwards, but by so little for the middle one that you would not make a profit.
Of the nine arrows looked at, there are six that would have succeeded if traded. By filtering with the oscillator we stayed out of one of the failures, making the success rate 75% rather than 66%. Not a startling improvement, but on the positive side, and I didn’t try to optimize the oscillator or try different ones, which may have given a better result. You need to take all factors into consideration to give your trading an edge.
Candlestick Trading Principles
Here is a summary of how candlestick charting methods are best used in your trading.
- Be sure to use other Western charting analysis along with candlesticks
- The more agreement between signals (candle patterns and technical analysis) the more likely the reversal
- The candle line shows the force behind each move, as well as the price
- The candlestick pattern requires both the shape and the correct trend
- A candlestick pattern alone is not justification for a new trade
- If a Doji sets a new high, wait for bearish confirmation by a close under the Doji
- Candlesticks do not give price targets
- Set stop loss levels by other means, and know when you are wrong and must exit the trade


Join the discussion