How to Find Cycles
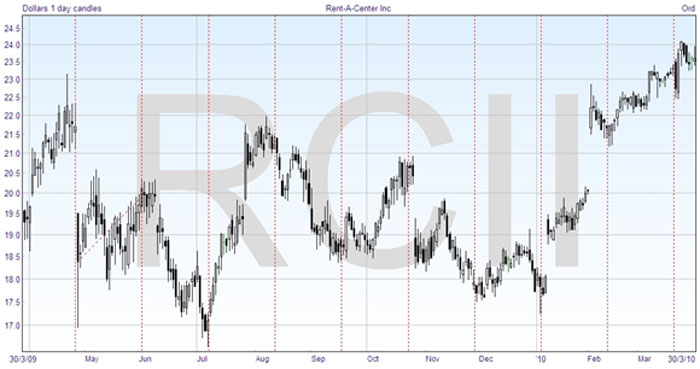
You will not be surprised to learn that computers have been applied to finding cycles in trading markets. As the human eye is still pretty good at discerning patterns, you can apply manually apply cycle lines on your charts, and the computer will draw a set of equidistant lines to the time period that you choose. Here’s the graph of a security to which I have added cycle lines.

The process is hit-and-miss, but fortunately very fast, so you can make many attempts to find the best fit. In this case I started with the low point just before May, on the left, and stretched the lines out until they seemed to fit. It’s usual when doing this to concentrate on the low points, as they tend to be more reliable.
You can see that the second line, if anything, was a peak in June, but many of the other extended cycle lines look fairly close to bottoms, so this cycle, which is just over one month, seems to be valid.
How to Use Cycles
Firstly, you have seen just above one use of cycles, and that is to suggest the position of the next low point. While a couple are slightly off, it can give you warning that the price may be about to turn. But that is only the start of using cycles.
The usefulness of moving averages and of indicators can be enhanced if the periods used can be tied into the dominant cycles for the security. Using the principle of harmonicity, you can take a simple ratio of the cycle, for example with an oscillator it seems to work best when the indicator uses a factor of a half cycle. So in this case you might try a period of 13 for the oscillator, bearing in mind that a month is between 20 and 23 trading days, and that 13 is a Fibonacci number.
You might also trade with a moving average crossover system, using one moving average based on the cycle length, and the shorter moving average based on one half or one quarter of the cycle.
Translation
Translation is an important idea when using cycles. It refers to the shifting of cycle peaks to the left or right of where they should be, if they were in the middle between two bottoms. As mentioned above, the bottoms are considered to be more reliable for cycle identification, and this is one reason why.
If the longer trend is up, that tends to make the peak shift to the right, which is referred to as right translation. In a bullish market, you would expect the price to spend more time going up, and less coming down, so this is logical. Similarly, you can get a left translation in a downtrending market for similar reasons.
Summary
By exploring the predominant cycles in the security that you are watching, you can make your trading more accurate and effective. The importance of cycles cannot be overemphasized, as they reveal a great deal more about the price characteristics that blindly trading with standard indicators and crossovers.
At the end of each module there is a quiz. You can take a quiz at any point, but we suggest you view each module before taking the quiz. When you’re ready to start the quiz, click the take quiz ‘Start’ button below -:
The Masters Certificate in Technical Analysis - Module 9
Congratulations - you have completed The Masters Certificate in Technical Analysis - Module 9.
You scored %%SCORE%% out of %%TOTAL%%.
Your performance has been rated as %%RATING%%


Join the discussion