Using Three Moving Averages
A further development on the crossover method uses three moving averages, and is appropriately named the triple crossover method. It’s just a development of the double crossover method which looks for some confirmation of the trade. You’ll find it used mostly in the futures market, and it was first mentioned in this context by R.C. Allen in 1972. The periods usually used are 4, 9, and 18 days, but 5, 10, and 20 are also used extensively with commodities.
Generally, the shorter period moving average will be closest to the price line, so we would expect to see the SMA(4) nearest to the price, SMA(9) next and SMA(18) furthest away. This applies whether it’s an uptrend or a downtrend.
If you are in an uptrend and the SMA(4) drops from its position adjacent to the price to cross downwards through the other two averages, this is called a selling alert. Typically it will signal to traders to liquidate their long positions. But when the 9 day moving average drops below the 18 day, then that is counted as confirming the reversal and a signal to sell short.
The same applies in the other direction. If you are in a downtrend and the 4 day moving average rises above the other two, then this is a buying alert, and a signal to liquidate your short positions. Only when the 9 day crosses above the 18 day is the signal confirmed, and the long position taken.
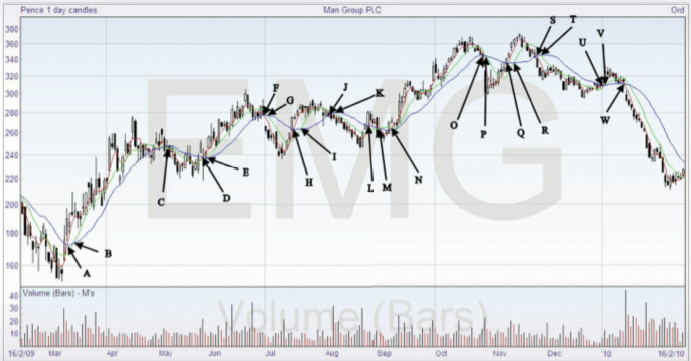
Here’s the chart we’ve been looking at, with the three moving averages added. Bear in mind that you can experiment with the number of periods, and also the type of moving average, and see what works best. This graph shows simple moving averages, the red is 4 day, the green is 9 day, and the blue is 18 day.

Going through this in order, at A we got a buy alert that was confirmed at B meaning we went long at about 193. The next part of the chart was volatile, but we got a sell alert at C, when the other averages were already crossed, so we would sell the long position and take up a short, with the price at about 245.
Going through all the signals, we get the following sequence –
| Trade | Enter at | Price | Exit at | Price | Profit(Loss) |
| Long | B | 183 | C | 245 | 52 |
| Short | C | 245 | D | 230 | 15 |
| Long | E | 250 | F | 285 | 35 |
| Short | G | 260 | H | 275 | (15) |
| Long | I | 285 | J | 277 | (8) |
| Short | K | 275 | L | 275 | 0 |
| Long | N | 270 | O | 340 | 70 |
| Short | P | 315 | Q | 340 | (25) |
| Long | R | 365 | S | 335 | (30) |
| Short | T | 320 | U | 310 | 10 |
| Long | V | 328 | W | 315 | (13) |
The total profit/loss is 91, less any commissions or fees. Note that there were 11 trades, 5 showed a gain, 5 a loss and on one the exit was at the same price as the entry. This shows how you do not need to have a majority of winning trades in order to profit, it all depends how big the moves are.
Also note that the sum of all long trades is 106, which is better than the 55 of the double crossover method. This does not necessarily mean that more complication gives a better result, as there are all the variables of the periods that could be experimented with and improved, but on balance the triple method should be slightly better than the double.
One final note – while you could trade just this system, in practice you would usually have a protective stop (stop loss order) to take you out of the trade if it goes in the wrong direction. For example, in long trade R to S, the price almost immediately reverses and a suitable stop loss might have liquidated that trade before the registered loss. We go into money management in Module 11.


Join the discussion