Gauging The Trend 2
Keltner Channels, when combined with oscillators and other technicals to identify cycle tops and bottoms, are an excellent analytical trading tool to determine support and resistance levels in trending markets either in the Keltner Channel itself, or the midline that runs through the middle of the chart. They are also used to identify support/resistance levels and breakouts of congestion ranges.
Keltner Channels
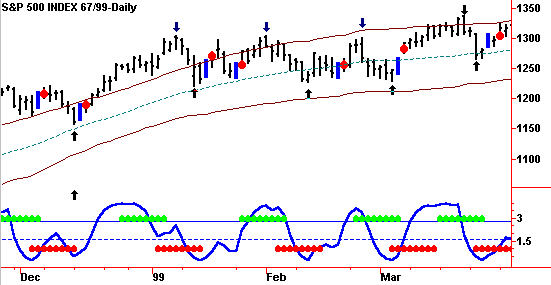
Notice how the last three trading cycle tops occurred near the upper Keltner Band. Also, three trading cycle bottoms occurred near the midline.
The Keltner Channel can be used on charts of any time frame, and is very useful as a component of a Cycle Trading Pattern when calculated in the time frame used to determine trend.
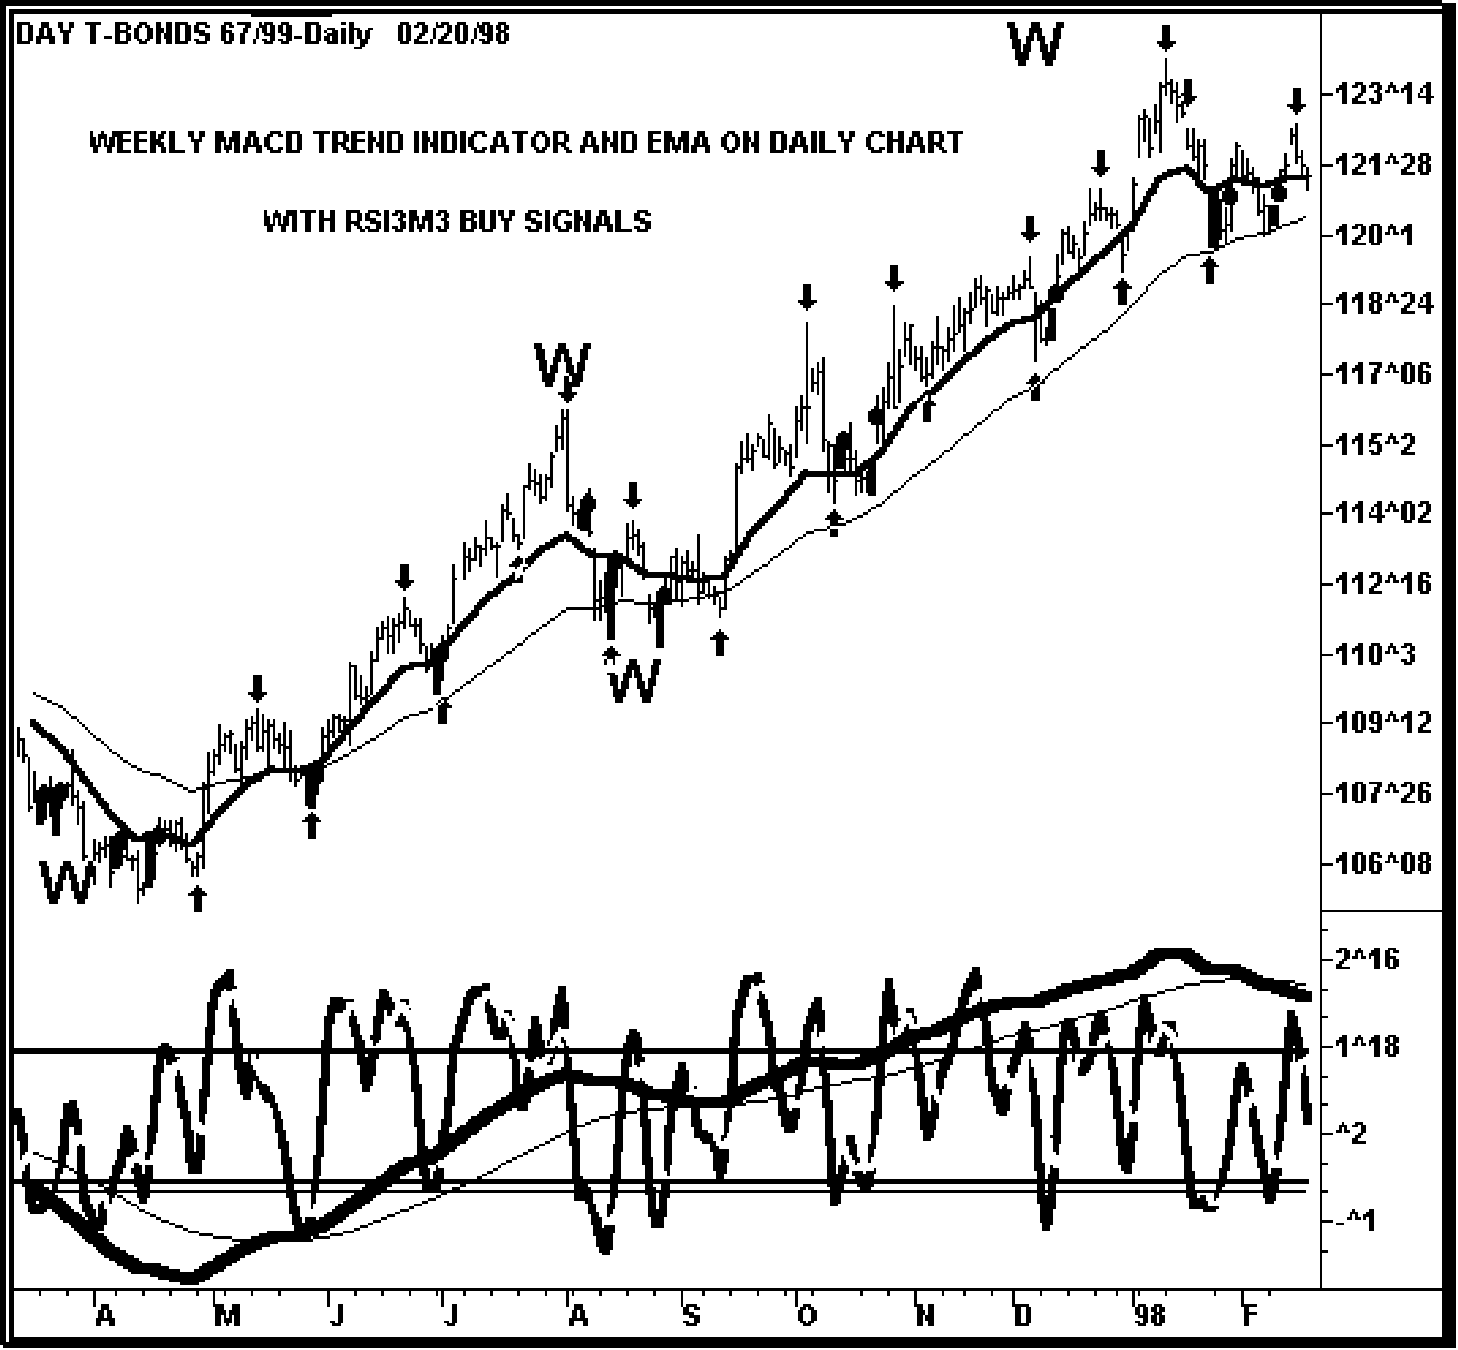
In the daily Tbond chart below, the trading cycle tops and bottoms are indicated by the arrows; the weekly cycle tops and bottoms by the “W”s. A 5-week moving average is plotted on the daily chart and the Keltner Channel is plotted 1.1 standard deviations above and below this moving average. Both the moving average and the standard deviation can be modified.
Chart 18
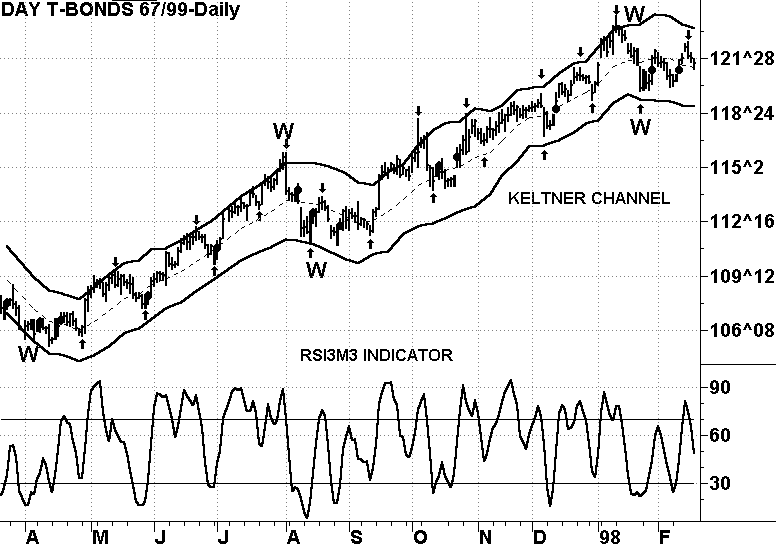
Following resistance at the upper channel a drop below the moving average as a trading cycle bottom is often followed by a sizable upmove.
When buying bottoms in the direction of trend the biggest moves often have a “rubberband” effect following an overextension to the downside. After meeting resistance at the upper channel line, a drop below the moving average would be an overextension if prices remain above the lower channel line basis the close. In our chart example, a drop below the moving average followed by an RSI3M3 mechanical buy signal above the lower channel line occurred at six trading cycle bottoms. All were followed by sizable upmoves. Notice that the price lows and trading cycle bottoms occurring above the moving average line had much smaller upmoves in price and often in time.
At times, an uptrend can be inferred by prices meeting resistance at the upper channel line, then dropping into a trading cycle bottom below the moving average, but above the lower channel line.
Cycle Trading Pattern Using Keltner Channel
For a buy signal, look for the following combination:
- Trend is up;
- A test of the upper band of the Keltner Channel;
- A decline below the channel midline, with price remaining above the lower Keltner Channel;
- RSI3M3 buy signal to enter the market.
Trendlines
Trends always end, and some of the same approaches used to determine trend can be used to confirm a trend reversal. Trendlines are also very powerful confirmers of trend reversals.
The Chart below shows trendlines on a daily chart. The two-uptrend lines are drawn across Trading Cycle bottoms and their penetration confirms the top of the larger weekly cycles. Upside penetration of the downtrend lines confirms the bottom of the weekly cycle. The weekly cycle averages 21 weeks and once the downtrend lines are penetrated a sizable up move can be expected.
Downside penetration of the uptrend lines is different because the cycles have moved up for close to 20 weeks (in bullish right translation), and a relatively short decline into the weekly cycle bottom would be expected.
Chart 19
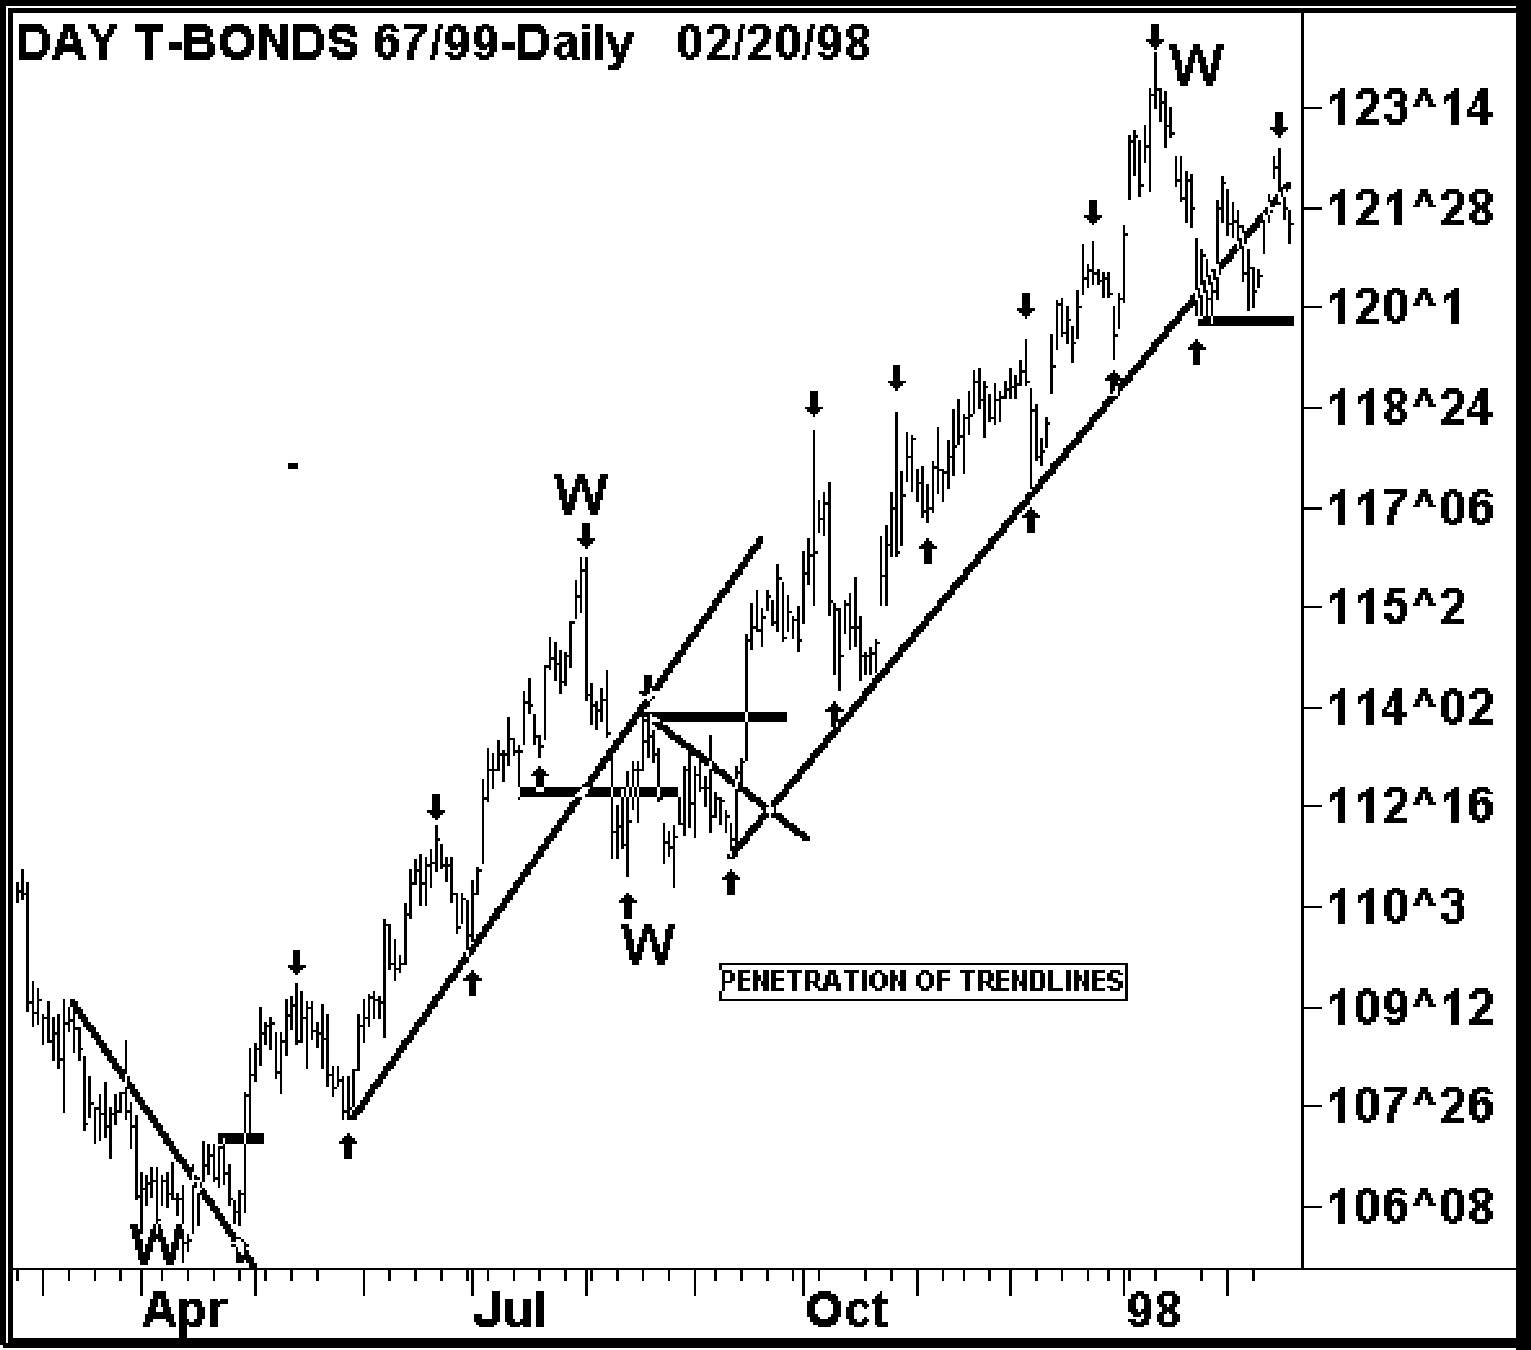
Trendlines drawn across trading cycle tops and bottoms often confirm bottoms and tops of the weekly cycles
Stand-alone buy and sell signals do not consider the whole picture. By combining trading signals with daily and weekly cycles, retracements, trend indicators, channels, trendlines and other technical tools into Cycle Trading Patterns you can greatly reduce your dollar risk and improve your trading results.
Chart 20
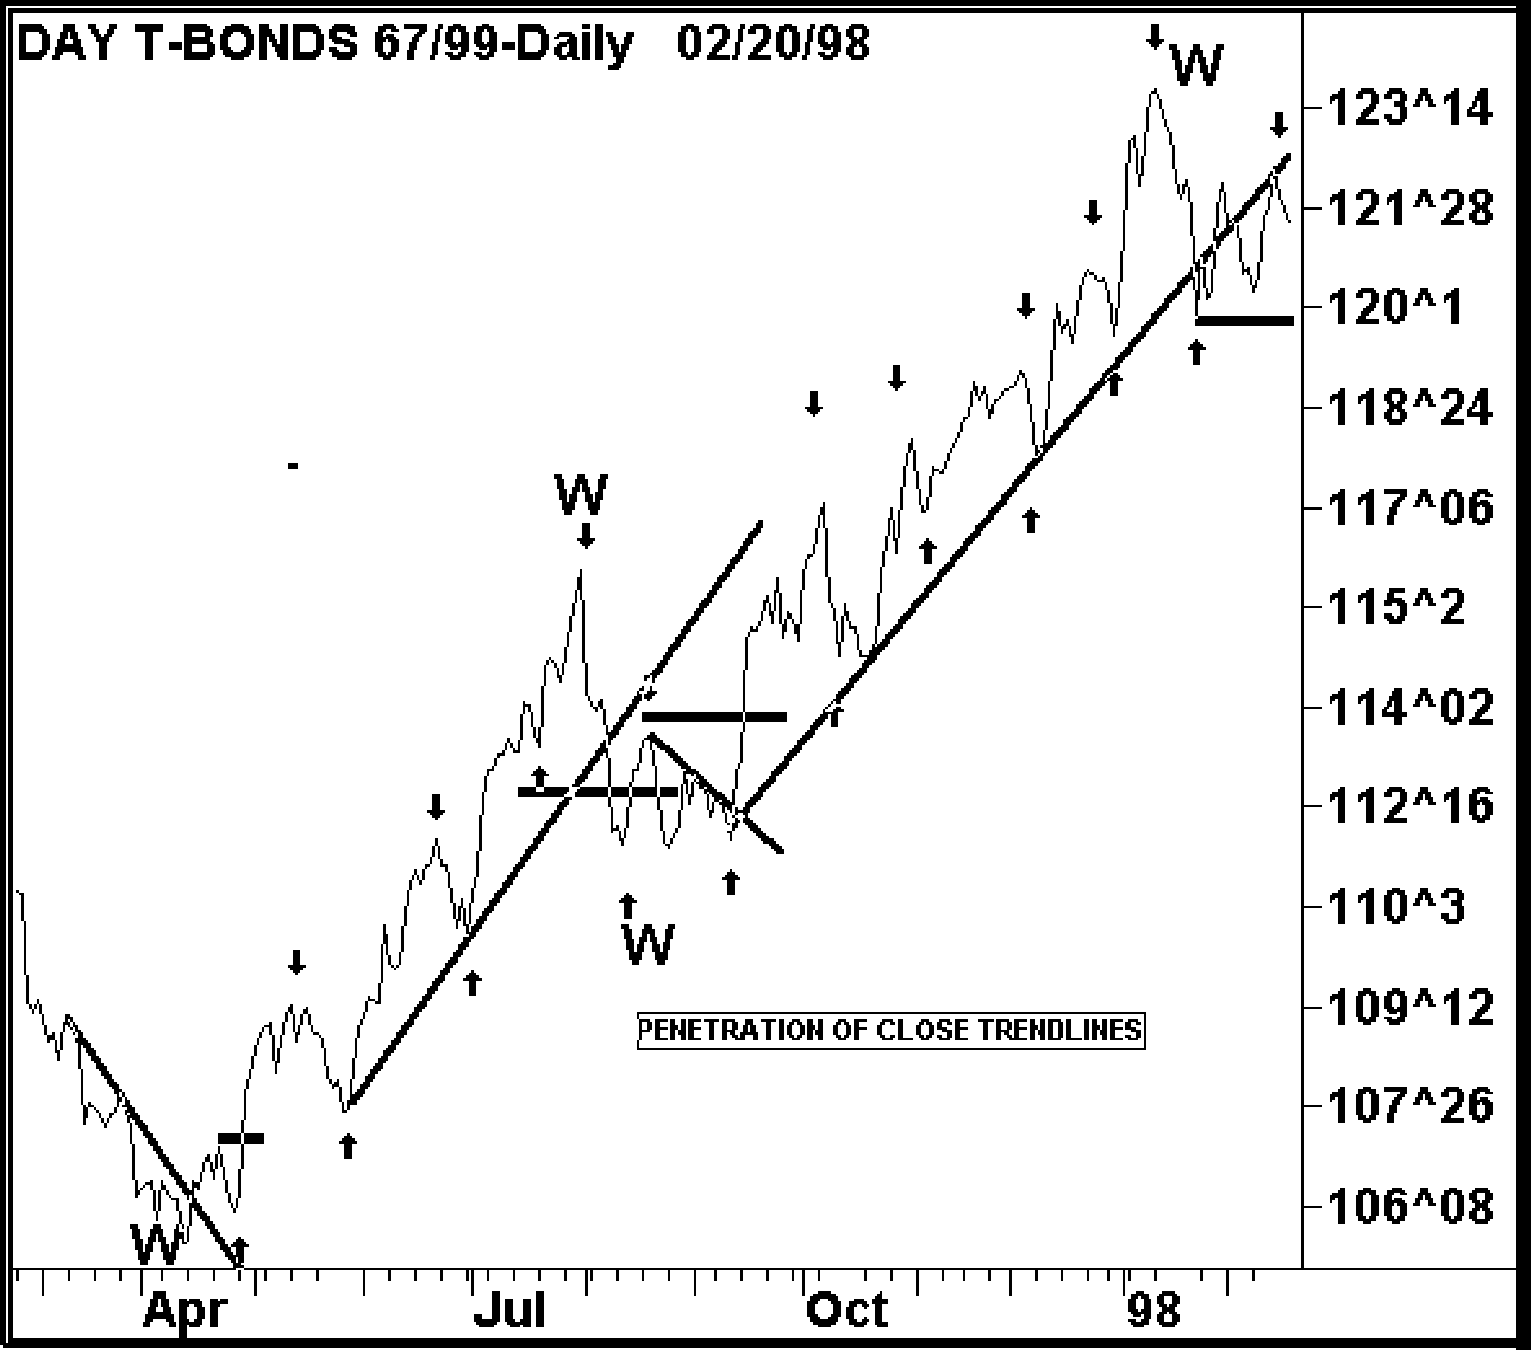
Close only chart with trendlines and cycles is very similar to a regular bar chart.
Most people use trendlines on regular bar charts, but a close below a close chart trendline is much more significant than simple price penetration of a bar chart trendline.
Chart 21 shows a typical combination of oscillators, trend indicators, retracements and mechanical entry signals. These combinations make patterns that are triggered by the mechanical buy signals.
Chart 21
This is a Cycle Trading Pattern you can use in most markets and time frames. Watch for the cycle bottoms to occur in the timing bands shown in Chart 9 (not shown here to avoid “chart clutter”).
Cycle Trading Pattern
- a drop below the thicker EMA line
- as the EMA line is moving up, and
- as the thicker MACD line is above the thinner line and moving up as
- a 20-day trading cycle is due to bottom.
- The entry signal is the mechanical setup and buy signal. The thick bar is the setup bar; the dot marks entry price.
Note: These Cycle Trading Patterns have used only the RSI3M3 oscillator and detrend. Similar patterns can be traded with the 3-10 indicator, CCI indicator, long-term RSI, stochastic, MACD detrend, or any other oscillator that tracks prices.


Join the discussion