For traders who exercise good risk management, selling short is no more risky than taking a long position. On the other hand, since stocks and commodities tend to fall faster during bear markets than they rise during more bullish market phases, properly executed shorts can be very profitable.
During bull markets, there is constant rotation from sector to sector and group to group. And above all, there is rotation from laggards to leaders and back again. Rotation presents occasional opportunities to sell short, even during bull markets, though the odds of success are greatly improved if short sales are confined to periods when the trend of the broad market is down.
As a general rule, it wise not to sell short unless both leaders and laggards are trending down. At the very least, both leaders and laggards should be trending lower below their respective twenty- to thirty-day moving averages. Short-side returns are best under those conditions (review: Playing The Odds).
Good short candidates will exhibit these key features:
1. Distribution over an extended time period. Such distribution is likely to be characterized by high volatility, high volume, and trendless price action.
2. A pattern of lower tops and lower bottoms. Even though an extended downtrend may not be clearly in evidence, selling pressure is often made evident by a tilt lower in the overall price pattern.
3. A clear sign of weakness. After a period of distribution, an issue will indicate it is ready to move lower by moving lower. Shorting before there is a clear demonstration of weakness can be hazardous.
4. A weak rally to overhead resistance. Once a target has offered a clear sign of weakness, wait for a rally back to supply before entering orders to short. Such a rally should show signs that bulls are exhausted. Light-to-moderate volume and gappy price action are often features of weak rallies. The approach of the target to a zone of former supply is likely to produce increased selling. These sellers are your allies, and their selling will protect your position against an extension of the advance. Short as close to overhead supply as possible.
McKesson
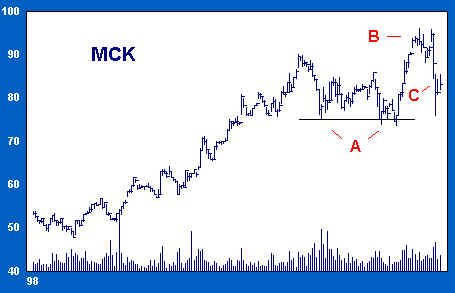
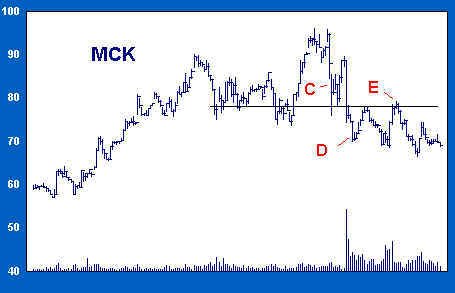
Over the first half of 1998, Mckesson (MCK) extended its advance of the previous year to a price just above 90. The stock then corrected to support around 75 before building a base (A). Twin terminal shakeouts below the support line, A, set up a strong rally to a new high around 95 (B). So far, indications are bullish. However, a sharp break on increased volume (C) puts us on alert. The stock is unable to hold its new high, and the urgency of the selling indicates that something is amiss. We suspect that the basing and subsequent rally to a new high are part of a campaign to distribute stock. However, the push at C does not break support at A. We watch carefully for more evidence of distribution and/or weakness.
After a quick rally from support in the mid-70s, MCK drops again on large volume to D (see below). This time, support is broken, establishing a pattern of lower highs and lower lows. The new low at D and a huge increase in volume on the decline together constitute a clear sign of weakness. After the initial low is made at D, the stock rallies weakly to supply in the high 70’s. This may be an opportunity to sell, but the stock is still very oversold. We decide to wait for a better opportunity, should one come.
After a shakeout on volume to a minor new low, MCK rallies to E. The rally begins well, but immediately runs into trouble as the previous zone of supply is reached. Distribution above 80 is broad. The small base which has formed around 70 is certainly not yet enough to mount a serious challenge of supply evident in the neighborhood of 80. We are now alert for an opportunity to short close to protective supply.
The stock rallies, and manages to eke out a recovery high just above the peak of the earlier rally from D. Volume remains high and the high-low spread narrows. This is a sign that buyers are again encountering sellers at this level. The new recovery high has doubtless stopped out or scared out weak shorts, a bearish development. This shakeout has provided the best moment to date to establish an initial short position. We place an order to sell short at the market.
Our short begins to work almost immediately, a sign that we are on the right side. A new low is followed by a quick rally, indicating the presence of support in the high 60’s. Only a solid move below support will convince us that we should add to our position.
So far support has held. Trading becomes dull around 70 and volume declines in a way that suggests that sellers are temporarily exhausted. By now, a fairly broad base has been built up between the high 60s and mid-70s, and volume has steadily declined. This is evidence of reaccumulation, and the rapid drop-off in volume and quiet price action may set up a rally. We have to pay close attention to our trade.
The stock begins to rally (below) on moderately improved volume. At F the price betters a daily high made four sessions earlier, and the price appears to be moving easily. We elect to exit our short position until the situation turns more favorable.
The rally carries above supply at E to 90, the point at which MCK first encountered distribution. At G, price reverses a strong intra-day upthrust on extremely heavy volume, action which we recognize as climactic. The rally has taken price into territory controlled by heavy-weight sellers. The high-volume reversal is an invitation to sell short. All conditions required to short are now fully realized. The follow-up rally back to supply at 90 provides ample opportunity to short at the market. The price is extended and near important supply. The weight of the evidence now allows us to take on a larger short position than we did in our initial probe of the short side at E.
The next chart tells the rest of the story.


