Stock Fundamentals On Trial: Dividend Yield, P/E and PEG
Nov 18, 2011 at 5:18 pm in Fundamental Analysis by
When learning the trading and investment ropes at the “Investment School of Hard Knocks” (not a real school) I was seduced by many alternative strategies. One such strategy was the Long Term Buy and Forget (LTBF) strategy of choosing stocks based on favourable fundamentals and locking them away in a drawer until you retire.
I think that the past few years have demonstrated the folly of holding apparently rock-solid stocks unconditionally in the face of adverse price action.
Since I was a little skeptical of the predictive powers of the simplistic easily accessible fundamental measures — dividend yield, P/E and PEG — and even more skeptical of the analysts’ forecasts thereof, a few years ago I decided to do a little back-testing of the link between favourable fundamentals and future price performance.
The Method
I collected the historic fundamentals for each of the FTSE 100 stocks for each of the five years to 2007, each stock having its own spreadsheet that looked like this:
I then consolidated the information for all of the FTSE 100 stocks into a single spreadsheet so that I could sort them by year and by fundamental ratio (dividend yield, P/E, or PEG) in order to identify the ‘star’ and ‘dog’ stocks for each year.
A Dividend Yield ‘Star’ would be a stock that had one of the top-ten dividend yields in a given year, and a Dividend Yield ‘Dog’ would be one of the bottom ten yielders.
A P/E ‘Star’ would be a stock that had one of the ten lowest Price/Earnings (P/E) ratios in a given year, and a P/E ‘Dog’ would be one with a top-ten highest P/E.
A PEG ‘Star’ would be a stock that had one of the ten lowest (Price/Earnings)/Growth (PEG) ratios in a given year, and a PEG ‘Dog’ would be one with a top-ten highest PEG.
The bottom line is that a ‘Fundamental Star’ stock in any given category (or ideally in all three categories) should have performed better, or at least no worse, over the subsequent 1, 2, 3, 4, or 5 years than a ‘Fundamental Dog’ stock — else what’s the point of holding it merely on the basis of the fundamental assessment?
I’m not saying that this was the best scientific method ever devised, but it was the best I could do with the information I had access to. Fundamental-driven investors would argue that my 5-year period was too short, but I think that realistically most amateur investors would ditch a stock that had not moved in the right direction within 5 years. And so they should, because the basic problem with unconditional long-term ‘buy and hold’ is this:
By the time you find out you were wrong, it’s too late!
Now lets look at some of the results.
Dividend Yield
While you might not expect a good dividend yielding stock (a Yield Star) to actually appreciate in price while you’re capturing the income, you would at least hope for the price to remain relatively stable (not go down) during the holding period.
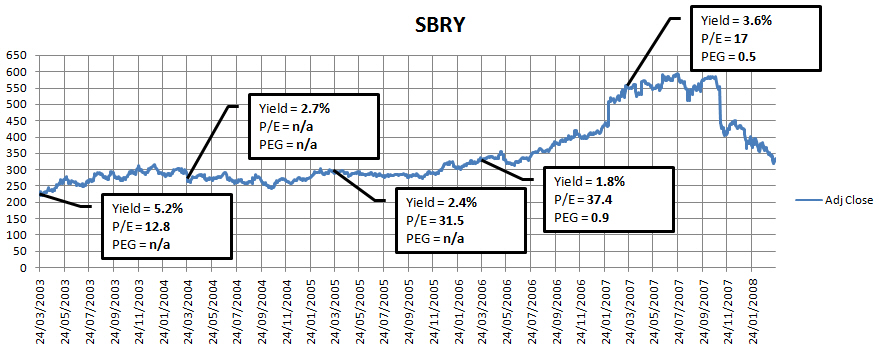
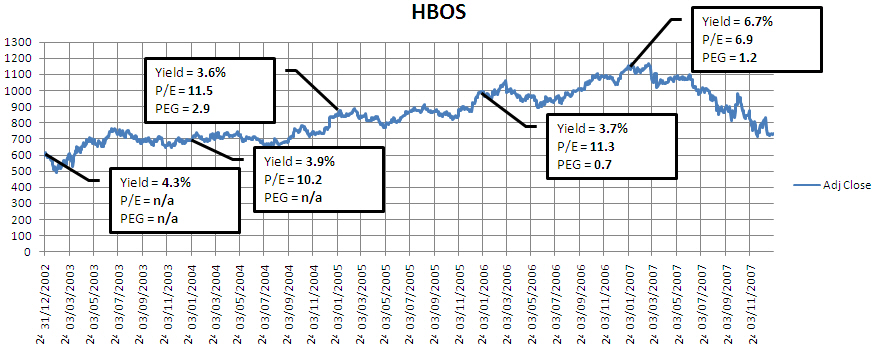
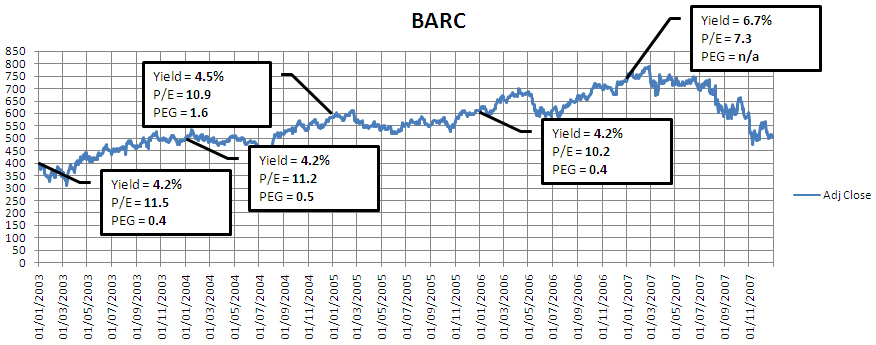
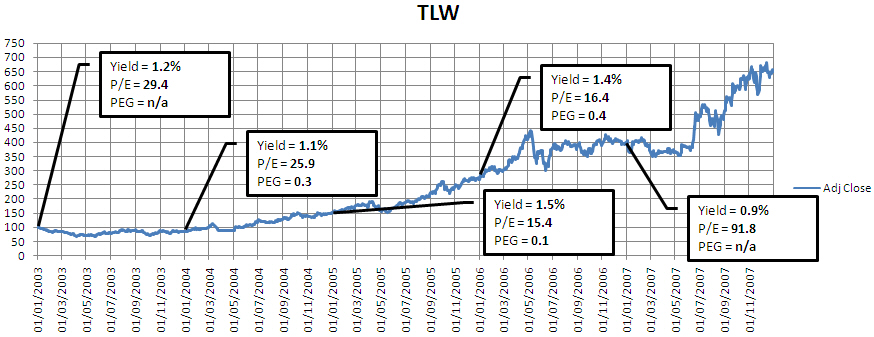
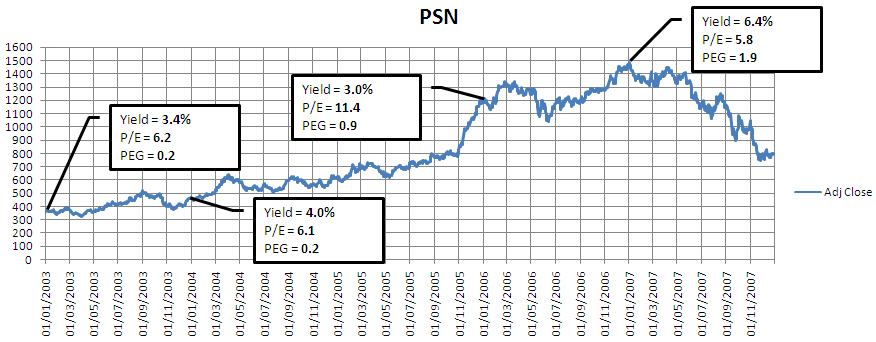
My initial analysis of my results led to the conclusion that stocks appreciated in price during a bull market regardless of high or low dividend yield; so you might as well hold the high yielding stocks. However, a significant increase in the dividend yield could herald a bear market as shown in these examples:
Notice how the prices fell with the dividend yields increased.
Actually, I have employed some slight-of-hand here by shifting the boxes one year to the left as though they were forecast fundamentals rather than leaving them shifted one year to the right to reflect the fact that they were actually reported fundamentals.
In reality those dividend yields increased as a consequence of the prices falling rather than as a precursor; as you would expect because if you halve any share price then the apparent yield automatically doubles as a result of sheer mathematical fact.
My point is that if, as assumed in my charts, the analysts had correctly forecast those significantly increasing yields one year before they we actually reported, then we could have used that information to time our exits. And if the analysts didn’t forecast correctly — which, in fact, they didn’t — then why should we make investment or trading decisions based on their forecasts at all?
In a nutshell: I would be inclined to hold dividend-paying stocks for income, but not unconditionally in the face of adverse price action, and not based solely on analysts’ potentially unreliable forecasts.
P/E
Some investors and traders are more concerned with the money that a company earns rather than the money it distributes as dividends. In particular, they are interested in the price they are paying for those earnings, as measured by the Price / Earnings (P/E) ratio. Conventional wisdom suggests that low P/E stocks are more attractive than high P/E stocks.
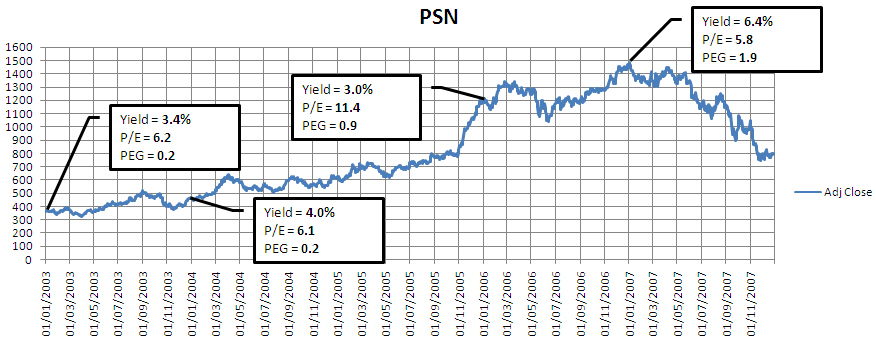
The following charts are representative of P/E Star (low P/E) and P/E Dog (high P/E) stocks during the period under test. Psion had a generally lower P/E, Tullow Oil had a generally higher P/E, yet they both appreciated during the bull market.
Remember that I shifted the boxes to the left in these charts, to give the illusion that these were prior forecasts rather than historic fundamentals. If we shift the boxes back to the right, we can see that the almost doubling of Psion’s reported P/E from 6.1 to 11.4 in January 2007 would have immediately preceded a period of price decline. The massive increase in Tullow’s reported P/E (one year later than indicated) to 91.8 also preceded a period of significant price decline in subsequent years, but you can’t see those subsequent years in my chart.
It seems that while low P/E and high P/E stocks can perform equally impressively during a bull market, any significant increase in reported (not forecast) P/E can herald a price decline.
In a nutshell: While I would not rely on the P/E ratio as a buying criterion, I would regard an unusual increase in P/E as a possible selling criterion.
PEG
Since high and low P/E stocks may be equally attractive in a bull market, some investors and traders factor the growth-in-earnings into their equations by considering the (Price/Earnings)/Growth ratio — which is called PEG. Conventional wisdom suggests that a lower-PEG stock (a PEG Star) may be an undervalued stock that will appreciate in price.
The following chart shows that the typical low-PEG (<1.0) stock Persimmon did indeed appreciate in value, at least during a general bull market, up to the point at which its PEG at 1.9 indicated that the stock may be over-valued.
Here’s the caveat:
In this chart I am once again presuming that the reported increase in PEG to 1.9 had been correctly forecast one year earlier than when it was reported. Therefore a high PEG, or at least a substantial increase in PEG, maybe a useful indicator of impending disaster… providing the analysts correctly forecast it.
In a nutshell: Low-PEG stocks may be attractive, as conventional wisdom suggests, but the usefulness is dependent on the accuracy of analysts forecasts.
Conclusion
As stated at the outset, this was not the most scientifically rigorous study ever devised. But it was rather more scientific than my limited anecdotal examples suggest, because there were many more such charts that are not shown here.
My overall conclusions were that, during a bull market at least, it didn’t much matter what the fundamental ratios were… because a rising tide did indeed lift all boats. A significant increase in dividend yield, P/E or PEG may be a more useful indicator… of impending disaster… but the usefulness of this observation may depend on the accuracy of the analysts’ fundamental forecasts. And I can tell you that in the final year under test, which coincided with the original 2007-2008 credit crisis, the analysts forecasts turned out to be very inaccurate indeed.
Whatever the merits of these fundamental measures in normal times, when a “black swan” event occurs outside of the normal distribution all bets are off! However ‘fundamentally sound’ a stock seemed when you bought it, the market will tell you — via a falling price — when to stop blindly holding and start selling.
Tony Loton is a private trader, and author of the book “Position Trading” (Second Edition) published by LOTONtech.


