Swing Trading: Getting Into the Swing, Part 1
Oct 12, 2011 at 11:04 am in Swing Trading by
The position strategy that I have already described works well in trending markets; i.e. when the prices of your stock holdings keep going up and up so that you can lock in more and more profits by raising your stop orders.
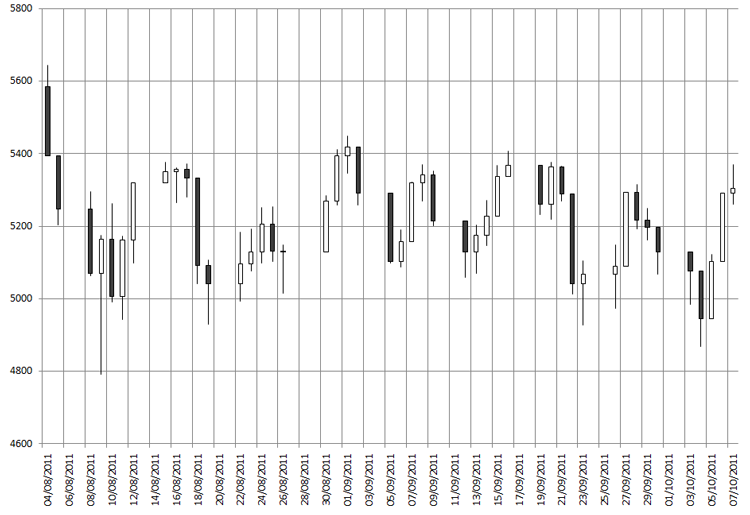
Sometimes individual stocks, and stock indices, do not trend at all. For a period of time the price may move sideways just as the price of the FTSE 100 index did from August to October 2011:

Look more closely at this chart and you will see that the price did not literally move sideways. It oscillated up and down around a mid-point of approximately 1200.
There was money to be made here by riding the up and down swings.
The Swing Trading Pattern
This subheading refers to a ‘trading pattern’ (a pattern of trading behavior) rather than the sideways chart pattern itself.
The trading pattern involves first establishing a long position at (let’s say) £1-per-point, at what you consider to be the bottom of the trading range. You then reverse the trade at what you judge to be the top of the trading range, by closing the long trade and opening a short trade at £1-per-point. On most spread betting platforms you can achieve the entire volte-face by simply opening a short trade at £2-per-point.
But there’s more to this pattern, because at some future time the price will not reverse as it is meant to, and will leave you riding a trend in the wrong direction. So, on each swing, this trading pattern would include the placement of a protective stop order just below (for the long leg) or just above (for the short leg) the trading range; to take you out of harm’s way when the price breaks out of the trading range.
The Devil in the Detail
While this approach to making money through swing trading seems perfectly plausible, the devil (of course) is in the detail. For one thing, we have the small matter of determining the high and low points of the trading range, so that we can buy long at the bottom of a swing and sell short at the top of a swing. In the case of the FTSE chart shown earlier, the peaks are reasonably consistent whereas the troughs seem to be all over the place.
One solution to the problem of catching the exact tops and bottoms would be to scale into a long position as the price falls below the mid-price, and then to scale out of the long position (and into a short position) as the price rises above the notional mid-price. A problem with this approach, though, is that if the price keeps falling then you will keep on adding to your long position in a process similar to “averaging down”; and vice versa for a short position.
Unfortunately a sideways price pattern is really only visible after-the-fact, by which time we may have missed some of the oscillations and by which time the price may just about be ready to go from swinging to trending. So in the next article I’ll look into the prospect of transitioning automatically from swing trading to trend following.
Tony Loton is a private trader, and author of the book “Stop Orders” published by Harriman House.

