Is the FTSE Trendy?
Dec 22, 2011 at 1:09 pm in Technical Analysis by
For someone who spreads bets, I’m not as much into technical analysis as you might think. Don’t get me wrong, I do think that it’s almost all about the price, but I think there is danger in spotting chart patterns where they really don’t exist; or where they do exist but they don’t foretell what they are meant to foretell.
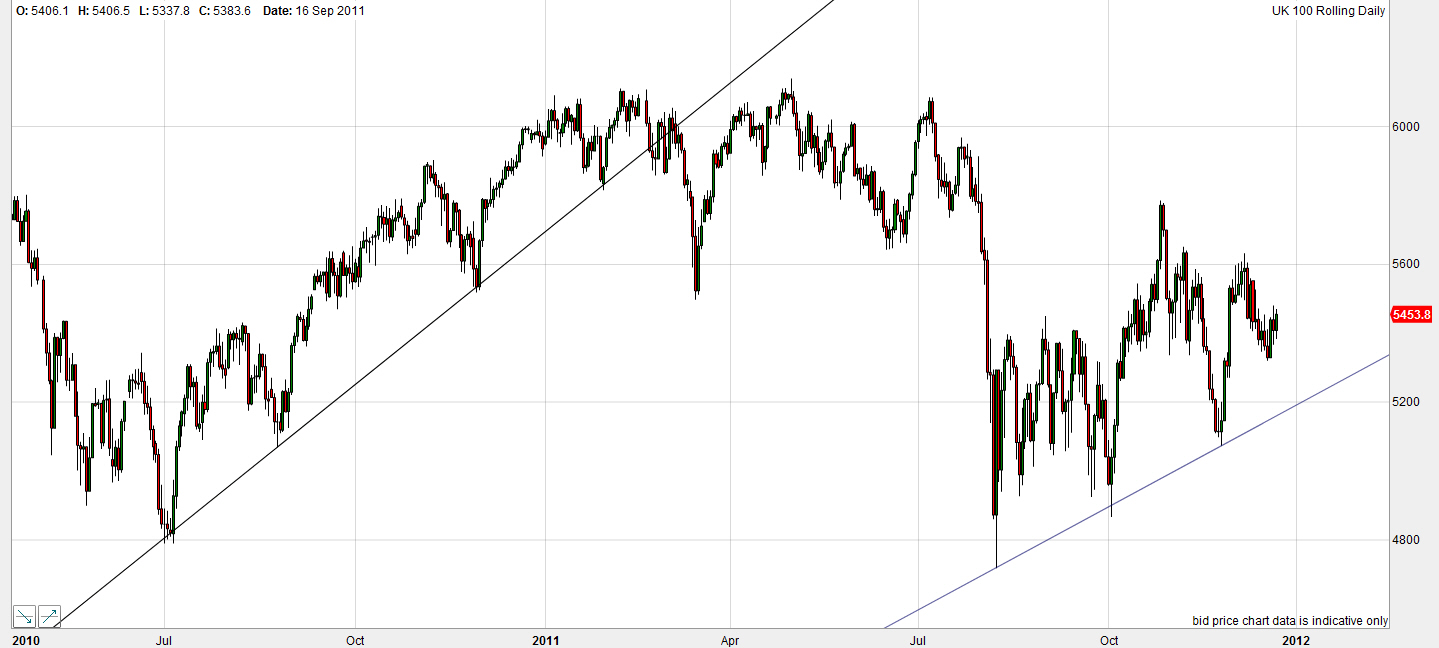
Nevertheless, the look of FTSE 100 price chart for the past 18 months has prompted me to draw a couple of trend lines as shown below.
The first trend line shows a series of higher lows (shown above) and higher highs (not shown above, but you can imagine) between June last year and January-ish this year.
The second trend line shows an unfolding series of higher lows accompanied by a not-so-regular series of highs over the past six months. If we believe in the “rising lows” trend line then the most recent rebound is not low enough, so the FTSE could fall again. If we believe that the higher lows must be accompanied by higher highs then the final “lower high” could mean that the trend is about to end. Either way, the chart might not be as bullish as at first it appears. All trends must come to an end, as did the first one shown above, and we might argue that we can only really see a convincing trend once it is about to end. And, of course, people will tend to see a trend if that’s what they’re looking for.
Trendy or Not Trendy? That is the question
Since I’m not currently inclined trade indices in my Trading Trail account, certainly not on those timescales with the necessarily-wide stop orders (and hence risk that I can’t afford), this question is somewhat academic; but worthy of note nonetheless.
Personally I am inclined to use the identification of a trend — on an index, commodity, individual equity or any other financial instrument — as confirmation to keep holding rather than as a signal to enter a trade when it might be too late to do so. I’m more likely to buy against the trend, contrarian fashion, and then hold with the trend as it unfolds; which can lead to a bigger profit in the end but a somewhat scary draw-down in the meantime.
One final thought:
A successful trader that I know reckons you can’t draw inclined trend lines at all, because the angle of inclination can vary massively according to which points you choose to include. His belief is that the only lines that you can safely draw on charts are horizontal lines like support and resistance lines. After all, a line is either horizontal or it isn’t, and you can’t really describe one line as being more horizontal than another one. Impeccable logic!
Tony Loton is a private trader, and author of the book “Position Trading” (Second Edition) published by LOTONtech.


