One MAN’s Support is Another MAN’s Resistance
Jan 17, 2012 at 7:11 pm in Technical Analysis by
You know about support and resistance; but do you know that one man’s support is another man’s resistance?
Resistance
I’m sure you know what price resistance is: a resistance level is a level at which we assume a rising price is more likely to rebound downwards than continue rising. It is the level at which a rising price meets resistance in the market, and it is deemed to be more credible if the price rebounds downwards from this level more than once.
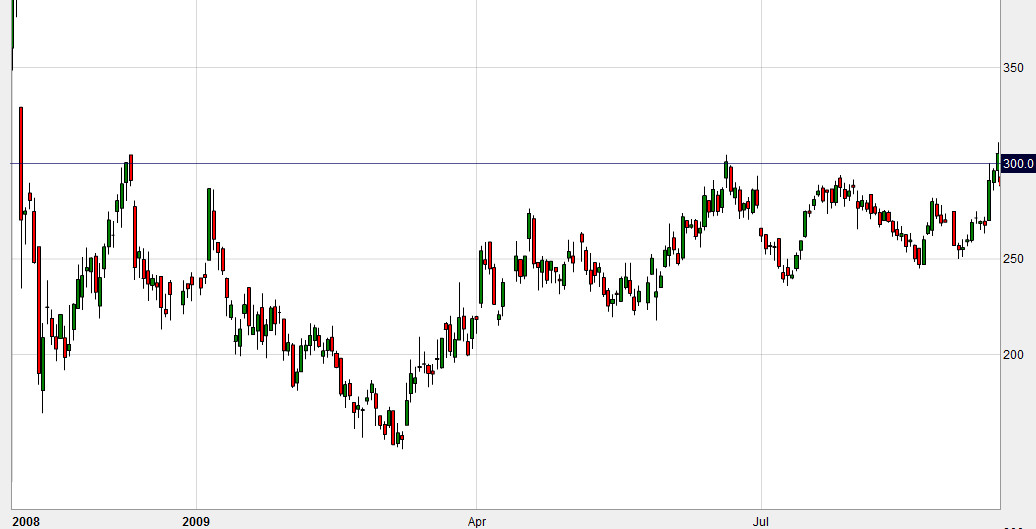
It’s not the best example, but it’s one that I can develop further as this article progresses, so take a look at the following price chart for MAN Group which — at the time it was taken — appears to show a resistance level at around 300.
Support
I’m sure you know what price support is: a support level is a level at which we assume a falling price is more likely to rebound upwards than continue falling. It is the level at which a falling price finds support in the market, and it is deemed to be more credible if the price rebounds upwards from this level more than once.
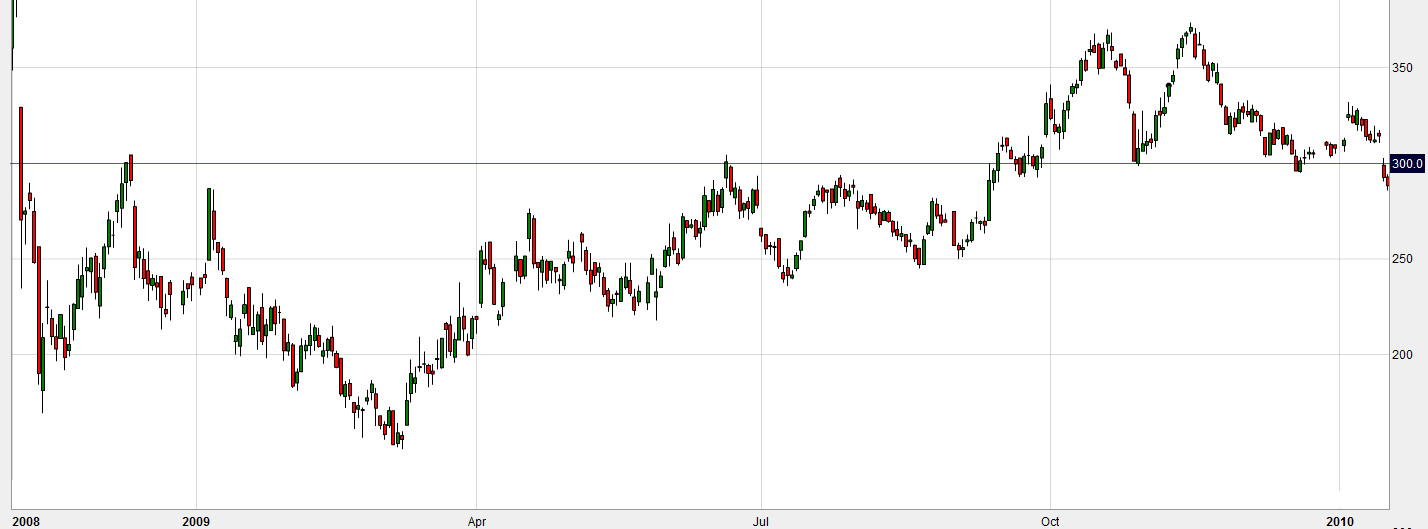
Take a look at the following price chart, also for MAN Group, which at the time it was taken appears to show a support level at around 300.
One Man’s Support is Another Man’s Resistance
What is really interesting is that my second chart follows immediately for the first, so we can glue them together as shown below to show how one MAN’s resistance (do you get the pun?) has become another MAN’s support.
When assessing whether a particular price level really is a support level, it may be beneficial to see if the price has previously met resistance at the same level — and vice versa.
What is also interesting about this example is that the support / resistance level corresponds with a nice round figure of 300. Prices do often seem to gravitate towards and then away from nice round figures that traders have established as price targets. It may also be true that these nice round figures demarcate potential “shake out” points, which is something to be borne in mind when deciding to place your stop orders.
The Long and Short of Support and Resistance
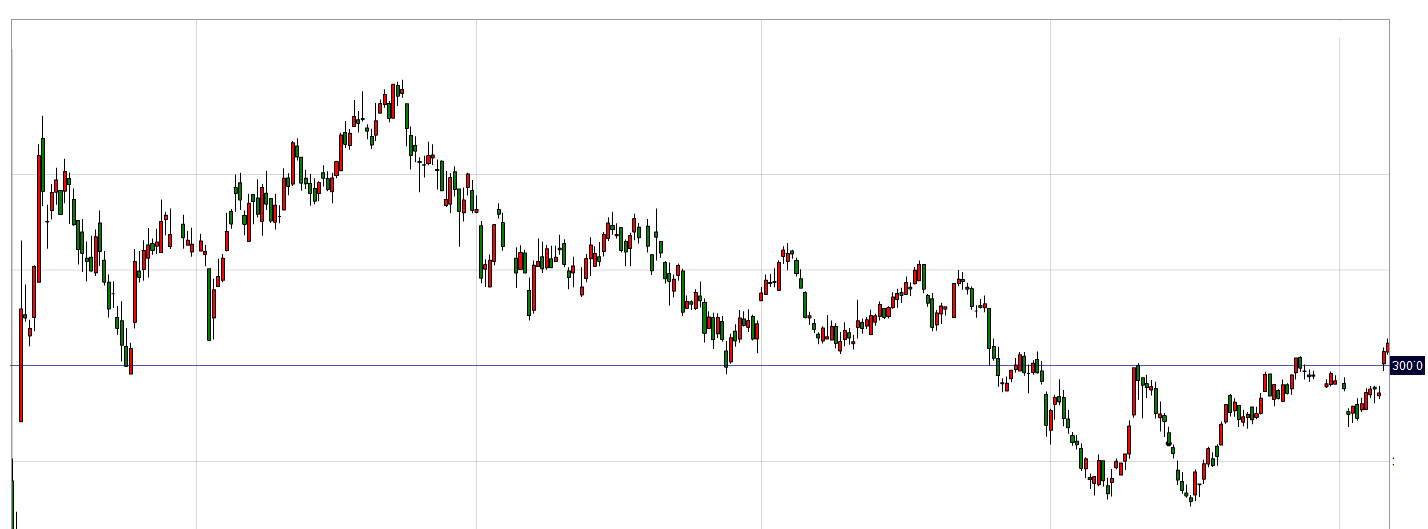
There is another way in which one man’s support is another man’s resistance, but not in the sense of a previous support level becoming a new resistance level or vice versa. A short trader might regard the long trader’s support as his resistance and the long trader’s resistance as his support as demonstrated by the inverted chart below.
Hey, this inverted chart doesn’t even look wrong — because the nice round figure 300 looks the same whichever way up you view it (if you can see that level of detail above). We could even run this price history backwards, by flipping the image horizontally, but I’ll leave that one to your imagination.
Tony Loton is a private trader, and author of the book “Stop Orders” published by Harriman House.


