Adventures with Spreadsheets
May 20, 2012 at 10:32 pm in General Trading by
Spread betting companies provide some great tools for tracking your current holdings and for ‘watching’ prospective purchases (and sales). Web sites like Yahoo! Finance and Google Finance also provide some great free tools for obtaining up-to-the-minute information and for maintaining portfolios, shadow portfolios (like my stop-out list) and watch lists. I particularly like the Google Finance Portfolio tool.
Sometimes the vendor-provided, paid-for or free tools are not enough and you’d like to do something rather more customised for your specific needs. Maybe you’d like to track your holdings across several brokers or spread betting companies, or maybe you just invented a new financial ratio (do tell!) that isn’t calculated and presented at the usual channels.
It sounds to me like you need to embark on some adventures with spreadsheets.
Choosing the Right Vehicle
In order to embark on this epic adventure we need to choose the right vehicle for the journey. Much of what I am about to described can (or at least used to) be achieved using Microsoft Excel, albeit via slightly different means. But for this excellent adventure I choose the Google Docs (soon to be renamed Google Drive) spreadsheet that anyone with a Google account can use for free at docs.google.com.
If you don’t already have a Google account by virtue (for example) of owning an Android mobile phone, you can sign up for one for free in just a couple of minutes. It’s worth the effort because not only is the Google Docs spreadsheet free to use, but also it is accessible by you from any web-connected device anywhere in the world thanks to the power of cloud computing. You can even share your spreadsheet creation with your friends or colleagues; but only if you want to… and if it doesn’t contain your ultra-top-secret Holy Grail route to riches.
A Sample Spreadsheet
Gone are the days when you needed to manually add financial data into your spreadsheet, and then retype it when that data changed. Thanks to the power of the World Wide Web, in my example spreadsheet shown below, all of the real-time price information is updated automatically whenever you reopen or refresh the sheet. All you have to do is copy one of the “model” rows to a new row and enter a new ticker symbol into the first column.
Thanks to the ability to share your spreadsheet creations — but only if you want to — you can even take my sample spreadsheet for a spin by accessing it at http://goo.gl/E5v5y. Do be nice and try to leave it how you found it, or at least keep the first “model” row (Row 2) intact for the next person to copy and paste into a new row. It will save me from having to constantly repair the spreadsheet by copying the content from my “protected” version.
Under the Covers
No doubt you will be keen to know how this spreadsheet works, so that you can experiment further. It’s all based around two ideas:
- The idea that you can compose a web address Uniform Resource Locator (URL) such as http://download.finance.yahoo.com/d/quotes.csv?f=nb2b3c6l1&e=.csv&s=HMV.L to fetch a Comma Separated Values (.csv) file from Yahoo! Finance containing specific financial data (like latest prices) for a particular ticker symbol.
- The idea that you can populate a Google Docs spreadsheet with the information using the ImportData() function.
On the first point, the information that is retrieved is coded into the tags nb2b3c6l1 that you can see in the URL. If you’re interested in other financial figures for your chosen ticker symbols, including stock fundamentals like the P/E ratio, then you can choose from the tags documented (not by me) here: http://www.gummy-stuff.org/Yahoo-data.htm
On the second point, in my sample spreadsheet I imported the required data, for whatever stock symbol was entered into the first column, by entering this formula into cell B2 and the subsequent cells of column B:
=ImportData(CONCATENATE(“http://download.finance.yahoo.com/d/quotes.csv?f=nb2b3c6l1&e=.csv&s=”,A2))
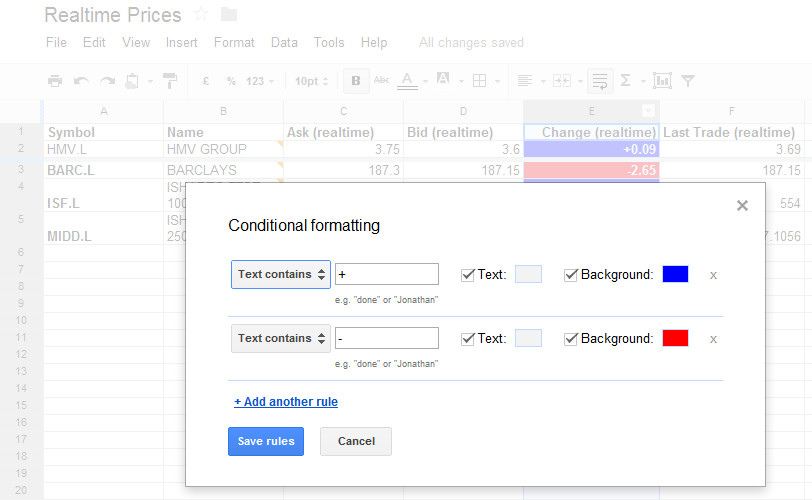
Finally I tarted up the Change column with colour by applying the following conditional formatting to column E:
Over to you!
Okay, so I’ve started you off on a spreadsheet adventure and now it’s over to you to complete your journey. If you like, you can let me know how it goes by entering a comment below.
Tony Loton is a private trader, and author of the book “Position Trading” (Second Edition) published by LOTONtech.


