Module 10 – Cloud Charts – the Ichimoku Technique
Introduction
It is not often that there is a significant breakthrough in technical analysis, but it seems that we are witnessing one with the recent introduction of Cloud Charts to the Western world. These charts are a recently discovered form of technical analysis which was developed towards the end of the last century in Japan. The full name given to them in Japan is Ichimoku Kinko Hyo, and that translates to ‘at one glance’ ‘balance’ ‘bar chart’.
Although, thankfully, we have not waited as long for the technique to come to the West as we did with candlestick charts (which was a couple of centuries), the method was being developed back in the 1930s in Japan by a man called Goichi Hosada. Though he published regular articles about his work, he didn’t reveal the secrets publicly until 1968 when he published his work in seven volumes.
At first sight cloud charts look complicated, which is ironic when you consider that Ichimoku means ‘at one glance’. However, when you get used to seeing them you will find that they do give you very quickly valuable information about the way the stock is trading.
For completeness, I’ll just give you the Japanese names here, but later in this module I will just refer to them by the easier to understand and remember English translations or equivalents. There are five lines drawn on the chart, and the first one is called Tenkan-sen, which translates to Turning Line. The second is the Kijun-sen, also know as the Standard line.
Kumo translates to cloud, and refers to a shaded area between the next two lines, which are the Senkou Span A (Leading Span A) and Senkou Span B (Leading Span B). The final line is called the Chikou Span, or Lagging Span.
Hosada felt that, once his method was understood, you should be able to understand the exact state of the market ‘at a glance’. He laid emphasis on three principles with which you should now be becoming very familiar — wave principles, price targets, and time. Cloud charts are available on many charting packages, and this module will help you understand the importance of the various indications.
Construction Techniques
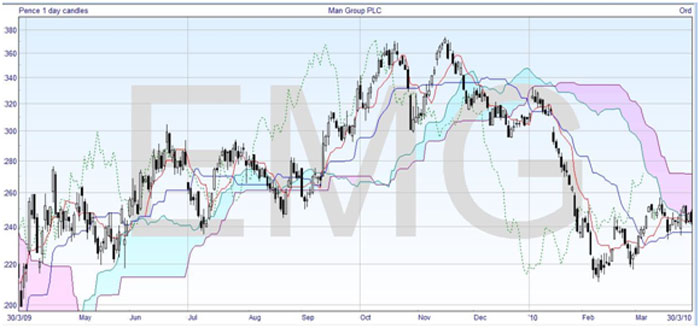
First, we’ll start with a view of a complete cloud chart so that you can see what we are aiming at –

Certainly, when you don’t know what you’re looking at, this can be confusing. You should be able to change the colors of any of the indications on your software, if it helps you follow it better, and you may also be able to thicken selected lines for emphasis when you are looking at those aspects of the chart.
I will build up the chart bit by bit as we look at each of the lines. I’ll tell you the time periods which are normally used, and then discuss any changes later.


Join the discussion