Q. What is a Moving Average?
A: This is an average of a chart over a set period of time say 20, 40, 200 days represented as a linear plot on a chart. What happens is that a trader selects a pre-determined number of days to examine, and then totals all of the prices for that time frame. A division of this total by the number of days being analyzed will yield an average. With each day going forward, the first day is subtracted and the new day is added, thus giving a new average. This is done for however many days one chooses to examine. Once the moving averages are calculated, the results are charted on a graph. In a down-trending market the moving average usually remains above the current price, while the reverse is true in an up-trending market. Thus, when the market closes above the moving average it can signal a rising trend which traders often use as a signal to buy.
Moving Averages help you identify trends and can be used with other indicators to show breakouts and trailing stops. For instance on a daily chart the moving average can be about 20 days while on a weekly chart it can be 26 weeks – an experienced trader would think carefully before going against this trend. Also, a faster moving average going through a slower moving average has to say that the price has started to accelerate in that direction.
A 200 day moving average is commonly used by institutions as a confirmation of a long term trend long or short and also to find out key support/resistance levels based on where a stock price is hovering in relation to the moving average. Some analysts use a variation of this theme by placing more emphasis on the current market price, believing that this helps to anticipate trend changes. They calculate a weighted average using a formula that places more value on the more recent prices. This strategy is called a Weighted Moving Average also knowns as the Exponential Moving Avearage (EMA).
Note: I recall reading a study by the Maths department of Warwick University some years back where they tested moving averages to find the optimum on the forex markets. The conclusion was that there wasn’t any moving that would make consistent profits just buying and selling the price crossover. This study implies that the moving average can’t be used as a stand alone buy/sell trade signal. It is only of value used for say a trailing stop or re-entering a trade after a pullback or reversals such as in MACD. An analyst at City Group followed up the paper with the same conclusions.
Q. One book suggests using a combination of 5, 20 & 200 moving averages, whilst another book suggests using a combination of 20, 50 & 200 moving averages…
I accept that it is probably down to personal preference, however I would like to know what people have found to be the most effective range to assess stocks. Both books suggest using a MACD of 9, 12, 26 days.
A: This is just a case of trying different settings and see what fits the timeframe you want to trade. Long term index trading uses 200×50 or 150×100 – so high numbers. Short term equities could be something like 15 or 20 price crossover. I prefer weighted moving averaged to exponential but this just a personal choice. Best of all if its available is TEMA (triple exponential moving average) which works like a dream when trading candle patterns/reversals. MACD not worth altering.
Q. But what is MACD?
A: MACD stands for Moving Average Convergence Divergence and is a trend indicator based on the ongoing difference between two moving averages (one long term and another short-term). A MACD can be displayed in the form of a histogram or as a graphic format which highlights the highs and lows and can show whether bulls or bears are in charge of the market (and their strength).
Some ideas about trading MACD (thanks to CHART TRADER)
-> Works better with some shares than others, so look back and see how it has worked previously.
-> Of little use when the share is trading sideways; the moving average will trade sideways and you will get lots of false signals.
-> Could be used to say that I have a lot of profit in this share and the next time the MACD crosses I will exit stage left.
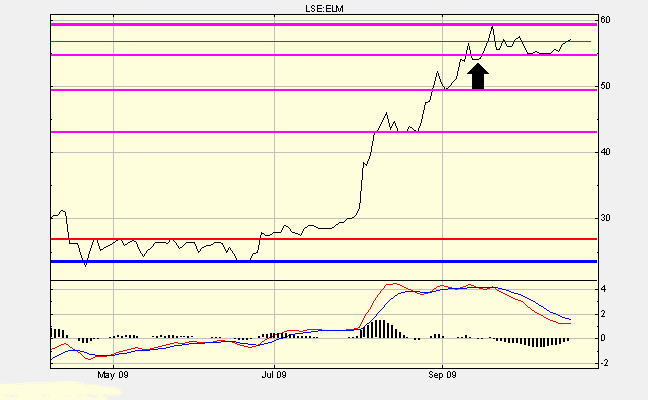
-> So with a stock like ELM if you had been trading with the MACD indicator you would have sold long ago. From the box chart below can see it is trading sideways, still above the previous higher low, so if I was holding this share I would wait and see which way it breaks.
 |
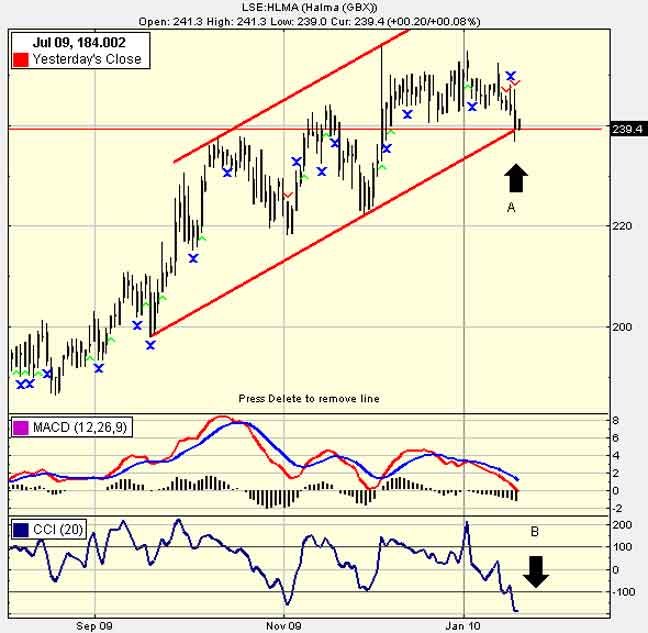
Below is another example concerning Halma (HLMA). What I see at point A is that the buying support is weakening further and has been for some time and is at the point of breaking down from its rising 9 month uptrend. The last trading statement back in December 2009 was flat with the hint of better things in the second half as a result of cost cutting. But despite a small rise following this the market then started to change. The hint that the price is running out of steam to the long side is in the MACD. Price makes a higher high but the indicator doesn’t. Usually, it isn’t a good idea to combine CCI with MACD. CCI may give a heads-up the stock is over-sold but the MACD is very negative but it is also a lagging indicator, so a bounce of the trendline is a trade or one can wait for an indicator to signal. The upper line needs to be re-aligned so it joins the tops….that means we haven’t got a channel exactly but that doesn’t matter.
 |

