A Brief History of Oil
Oct 27, 2012 at 3:37 pm in Fundamental Analysis by Dave
Oil, crude, brent, light sweet, black gold – whatever you want to call it, one thing’s for certain, it is perhaps the most important of all commodities, one we cannot currently live without, being the source of power for our industry, for our vehicles, in fact for our life in general. Oil is so important to us that sometimes it’s not the economy that influences its price, but its price that influences the economy. In fact, on many occasions oil has actually been the catalyst to a recession – a story truly of the tail wagging the dog.
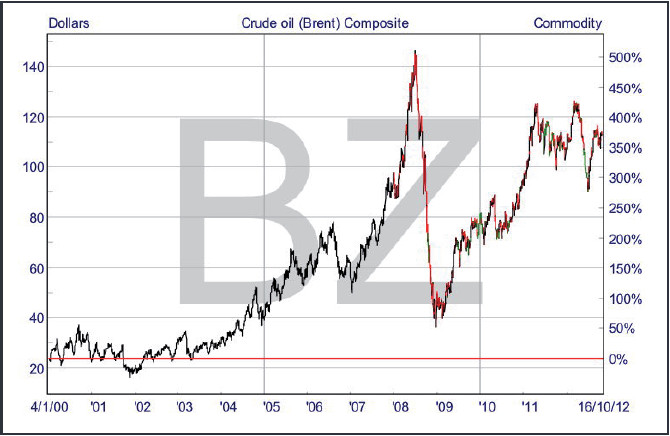
Following World War II, the price of oil was relatively stable, especially when adjusted for inflation, but in the last 10-15 years, volatility has been immense and the price has risen inexorably. While oil traded around $2.50 and $3.00 between 1948 and 1960, it has been trading between $16.50 and $146.00 in the period between 2000 and 2012.
‘After the gold rush of the 19th Century, humanity discovered another commodity to explore during the 20th century and into the 21st – the Fossil Fuel that is Oil.’
A Brief History of Oil Prices
After the end of World War II, the price of oil was heavily regulated through both production and price controls in order to keep the commodity relatively stable as its importance in the economy was rising. First, the Texas Railroad Commission was responsible for controlling the output and effectively imposing production quotas to control prices. After OPEC was established in 1960, power changed hands and it soon became clear that the US was no longer in control of the oil market. Let’s take a brief look at what happened through various time subsets:
The Calm After the War – Post World War II Period between 1948 and the End of 1960’s – Stability is the proper word to define this period as oil prices were effectively controlled, simply gyrating between $2.50 to $3.00 — just a 20% rise over almost 20 years. Adjusted for inflation, real prices didn’t change much. In 1960, OPEC was created with five founding members: Iran, Saudi Arabia, Iraq, Kuwait and Venezuela. Fortunately, OPEC members didn’t know at that time how they could influence oil price otherwise we would have had even more geo-political woes during the Cold War period. Even though demand for oil products increased in the post war period, prices didn’t, however, change much.
The Transfer of Control from Texas to OPEC in March 1971 – In 1971 Qatar, Libya, Indonesia, UAE, Nigeria and Algeria joined OPEC giving some extra power to the organization. When, in March 1971, the US ran out of spare production, and so no longer being able to put a cap on oil prices, the power to influence the market definitely shifted to OPEC.
The Yom Kippur War and the Oil Embargo – After an attack on Israel led by Syria and Egypt, several western countries condemned the aggression and the stage was set for serious potential conflict during this worrying period.. Middle East producers reacted by embargoing oil production and prices shot up from $3.50 in 1972 to $12 in 1974. That was the first real sign of the power OPEC could wield.
The Eye of the Storm between 1974 – 1978 – This was a range-bound period for oil prices, during which they oscillated between $12.50 – $14.50. Adjusted for inflation, however, there was even a small decline in prices.
The Iranian revolution and Iraqi attack – Iran not only went through a tough revolutionary period but it was also invaded by Saddam Hussein’s Iraq. Between 1978 and 1981 oil prices rose from $14 to $35 as output was substantially reduced with these two OPEC members at war.
Increase in non-OPEC Production and Fast Decline in Prices — With prices rising, many non-OPEC countries took the opportunity to raise their production significantly. Saudi Arabia also broke ranks, tiring of ineffective production quotas restrictions by other OPEC members, and so increased their own oil production (to increase revenues from the quantity side instead of price). At the same time, the first signs of serious investment and momentum away from oil dependence by Western economies were emerging. The net result was disastrous for the oil price which dipped below $10 in 1986.
Kuwait Invasion and the Gulf War – In 1990, Iraq invaded Kuwait. The oil price spiked, but soon after the US joined forces with Kuwait against Iraq, prices again gradually decreased.
Economic Prosperity through to 1997/98 – Western economies and Asia did particularly well during this period. Demand for oil products increased substantially, and China emerged as a major consumer with its own economy growing more than 10% per year. Oil dependency was at its highest for many years and with Russia experiencing a decline in production, oil prices increased again.
Subsequent Asian Crisis – The quick downfall of Asia in 1997/8 as a consequence of a major borrowing binge and currency crises led oil prices into a renewed downward spiral, but OPEC was able to successfully cut production in order to sustain prices. At the end of 1999, oil price was back near $25 after dipping as low as $10 in early 1999. The slowdown in the global economy continued until 2003, but OPEC was able to keep prices in a tight range, centred around the $30 a barrel level.
Speculation Age – During the last ten years, commodity markets have been opened to new investors with institutions and hedge funds embracing the ability to speculate on the oil price. This has led to a huge increase in volatility. The oil price has probably changed much more during the last ten years than over the last fifty. At the end of 2001, the oil price was around $16.50 a barrel, but with the growth in investment in the sector and the phenomenal leverage available to these investors it embarked on a remarkable rally, hitting a historical high of $146.27 on July 3, 2008 (as measured by the Brent Composite). Oil then had one of its sharpest reversals on record as the leverage was unwound, closing the year quoted at $45.59, an amazing 69% drop in just six months as the chart below pays testimony to.

Why has the Oil Price been Rising so Fast and been so Volatile?
Explanations for the fast and for the volatility elements are based on different factors. Firstly, simple physical demand for oil has risen dramatically in recent years while supply simply hasn’t been able to keep up, being punctuated by the adventures of the US & NATO in the middle east during the last 10 years. With regards volatility, speculative involvement in the market has also risen exponentially as big institutions have looked to diversify themselves away from paper assets given the money printing experiments being undertaken by most of the world’s major central banks. In fact, there are now much more exchange contracts for future oil delivery than actual real deliveries. The oil market is, quite simply, now much more open to speculation and so susceptible to more violent moves.
Over the last decade, China has been growing at more than 10% per year. The development model for the country relies on public infrastructure investment and on export industries. To develop and grow at a 10% rate, demand for oil products has naturally skyrocketed in tandem. China has, in fact, been the marginal consumer that has contributed the most to the rise in oil demand. Adding to China we have Brazil, India and other populous countries that 10-15 years ago were described as emerging and now have, by any measure, well and truly emerged. With the conflicts in the MENA region and spare production at very low levels, not even OPEC has been able to exert a meaningful dampening influence over prices.
‘There are now much more exchange contracts for future oil delivery than actual real deliveries.’
Speculation, arguably, just accelerates price adjustment and also amplifies reactions to events. A main driver for the speculation in oil has been the Federal Reserve and its debasement policy through quantitative easing programs. As a reaction to the sub-prime crisis, the FED quickly started lowering its key interest rate down to the zero bound. As this proved ineffective in restarting the economy from the debt overhang they then embarked upon spending trillions of dollars buying treasury bonds and mortgage-backed securities in a desperate monetary easing episode.
Meanwhile, although Europe avoided engaging in currency debasement policies, much to the chagrin of the Southern European members, the decrease in interest rates in the Eurozone and the strong Euro depressed bond yields dramatically here.
The debasement of the dollar further decreased the attractiveness of dollar-based low-risk assets, creating difficulties for several institutional investors that were traditional holders of such assets. Consequently, they went in search of better returns elsewhere, not least to satisfy the pensions actuaries not used to sub 8% returns. Gold and oil now form a core component of many institutional portfolios.
What has Happened in 2012
This year has been a tough year for oil. After hitting a year high in March, it has dropped significantly more than the broader global indices. “Super” Mario Draghi’s pre-announcement of a bond-buying program in July and QE3 prospects have put a light under oil prices recently, but it is still underperforming other asset classes.
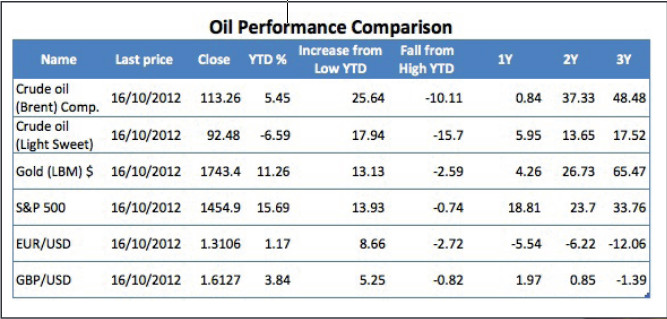
Intriguingly, Brent Crude is up 5.45% YTD, and yet the other sister benchmark contract WTI Light Sweet is down 6.59% on the year. The S&P 500 at time of writing is up 15.69% YTD. One indicator of this under performance is the fall from YTD high. While the index S&P is less than 1% below its high, Brent and WTI are 10% and 15% below respectively.

Where Should you Put your Money Now?
With such a high volatility, it is not easy to trade the oil markets, especially if you are looking for short-term return.
In the near-term, the fundamentals point to a resumption in demand from China, and so far OPEC has not indicated any meaningful supply increases are around imminently. Similarly, signs of the US economy finding its ‘mojo’ again are likely to be supportive of prices, at the very least. In September, housing starts and permits rose substantially the latest non-farm payrolls report has shown a decrease in the unemployment rate back below the key 8% level, and, most importantly, consumer sentiment is now back to pre-crisis levels. All these improvements, allied with the current QE3 program, will likely put upside pressure on the oil price. We have also to account for the institutional interest in oil. As long as interest rates are expected to stay low and bond yields remain artificially depressed, institutional investors will no doubt continue to seek incremental returns from commodities, including oil.
Brent Crude – WTI Spread Trade Opportunity
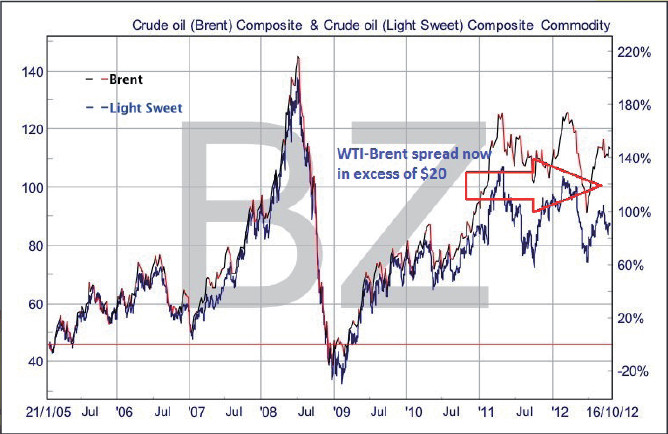
The most interesting situation for us, however, is in relation to the current spread between US oil — WTI Crude & Brent Crude. Production in the US has been quite buoyant in recent years, especially from the controversial shale oil, but the pipeline infrastructure has not been able to distribute it effectively. Consequently, oil is stockpiling at Cushing. This logistics issue is in the process of being rectified, however, and we think that the excessive discount of Nymex WTI relative to Brent is likely to diminish over the coming months.

A less risky trade on the oil price is therefore potentially to Buy the WTI contract and Sell the Brent contract — the so called WTI — Brent differential. Historically this spread has traded with a $1 – $2 price differential, but now WTI trades at a $20 discount — see chart. A pairs trade in equal proportions could be in order.
Article reproduced from the November edition of Spread Betting eMagazine

