Financial Trading Patterns #10: Market Examples
Dec 1, 2011 at 6:01 pm in Orders by
Financial Trading Patterns #10: Market Examples
Having demonstrated nine Financial Trading Patterns stylistically, in this article I’ll put a couple of those patterns into the context of real market charts. My idea is to show not only how the trading patterns can work in practice, but also how they might sometimes fail. Do keep in mind that I chose these charts with the benefit of hindsight, specifically to demonstrate the points I wish to make.
LIMIT BUY, LIMIT SELL
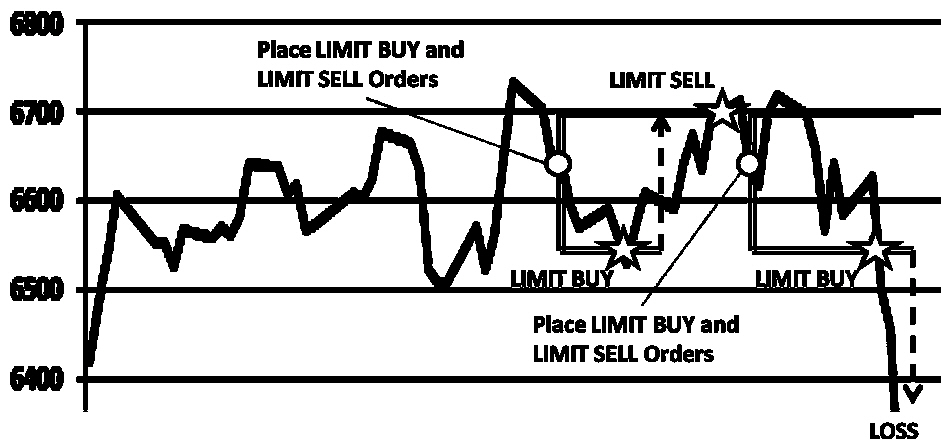
The following figure shows the historic FTSE 100 index price in the period May to October 2007 overlaid with the LIMIT BUY, LIMIT SELL pattern.
 I’ll now explain the consequence of this sequence of events for the long-only trader and the long-and-short trader.
The Long View
Having observed what he believes to be a possible trading range, the long-only trader places LIMIT BUY and LIMIT SELL orders, to buy-in near the bottom of the range and sell-out near the top of the range. Sure enough, the LIMIT BUY and LIMIT SELL orders execute as expected and he banks a profit.
Flushed with success, he repeats the setup, but this time with different consequences. Having placed another set of LIMIT BUY and LIMIT SELL orders, the price rises, but the higher LIMIT SELL order at 6700 does not execute because the long-only trader cannot sell something that he doesn’t already own. When the price falls again, the LIMIT BUY order executes as expected, but the price continues to fall thus generating a loss — at least on paper.
This real-life sequence of events demonstrates both a success scenario and a failure scenario for a long-only trader employing the LIMIT BUY, LIMIT SELL pattern.
The Long-and-Short View
Whereas the long-only trader ends up with a loss in this scenario, the long-and-short spread bettor or other trader could actually make a profit as follows.
The first LIMIT BUY, LIMIT SELL combination executes exactly as before, generating a profit.
As soon as the second set of LIMIT BUY, LIMIT SELL orders have been placed, the price rises. When the rising price reaches the LIMIT SELL price, that order can execute because a long-and-short trader can sell something that she doesn’t already own. When the price subsequently falls, the LIMIT BUY order executes to close the prevailing short position at a lower price. Thus, over the two cycles, she banks double the profit of the long-only trader and is not left holding a paper loss.
TRAILING STOP BUY, TRAILING STOP SELL
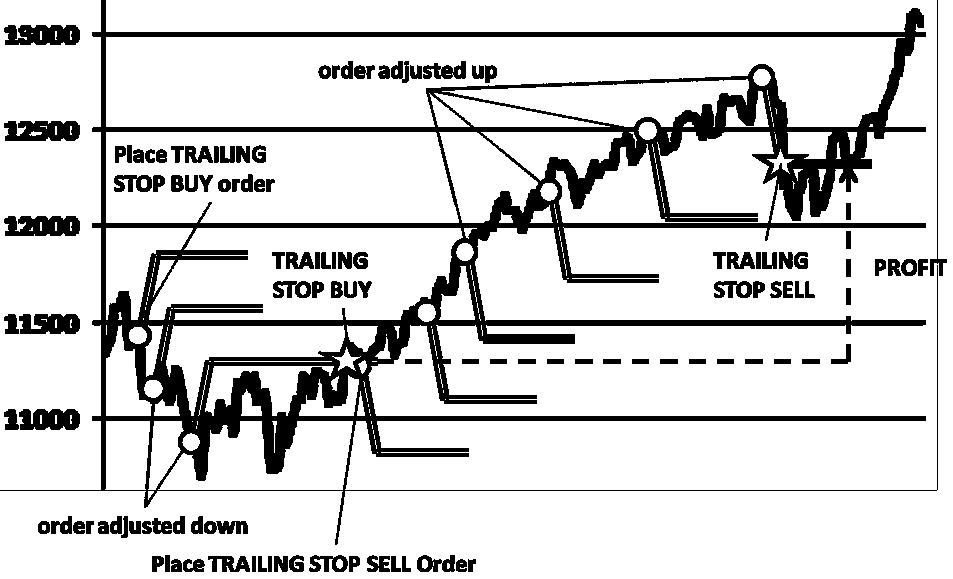
The following figure shows the Dow Jones Industrial Average (DJIA) index price over the period May 2006 to April 2007 overlaid with the TRAILING STOP BUY, TRAILING STOP SELL.
 Upon observing a downtrend, we place a TRAILING STOP BUY order that will execute when the trend reverses (price starts to rise). The TRAILING STOP order falls automatically in line with the falling price, such that, when the price does start to rise, we buy-in at a slightly more attractive price than if we had bought-in immediately at the outset.
We then immediately place a TRAILING STOP SELL order, which rises in line with the rising price. The uptrend continues for some time until, when the trend breaks, the TRAILING STOP SELL executes and we close the position with a healthy profit. As it happens, we need not have sold out when we did, because the uptrend re-establishes to take the price to an even higher level. But at least we held on to most of the gains we had made.
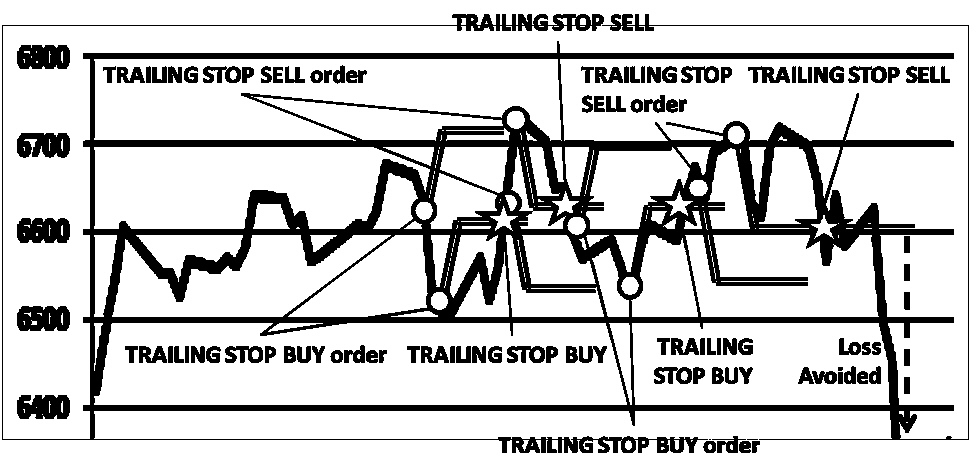
The real problem occurs with this pattern when the price does not trend down and then trend up as expected. You can see in the following figure what happens when the price simply oscillates.
 Upon observing what we think to be the start of a downtrend, we place a TRAILING STOP BUY order; which adjusts down, and then triggers when the downtrend reverses. We immediately place a TRAILING STOP SELL order; which adjusts up, and then executes when the uptrend reverses.
Do you see what has happened? We sold-out at pretty much the same price that we bought in, having made no real profit once any transaction fees (in a traditional brokerage or CFD account, but not a spread betting account) have been accounted for.
Then it repeats.
As soon as the TRAILING STOP SELL executes, we place another TRAILING STOP BUY order to buy-in when the new downtrend reverses. That order executes (buys-in) again at pretty much the same price. We immediately place a TRAILING STOP SELL order, which rises with the price and then subsequently executes (sells-out) at – guess what? – the same price!
We’ve traded several times in succession, and made no profit, which serves to demonstrate the slight flaw in this pattern. Although we avoid big losses, we stand to notch up many small losses (thanks to dealing charges) in a sideways-trading oscillating market. Look out for the big drop at the end of the price chart, though, which we have certainly avoided thanks to the execution of our final TRAILING STOP SELL order.
Before we leave this example, I’ll hint at how we could have avoided the small ‘whipsaw’ losses incurred while the price oscillated. One way would be to place the STOP orders at a smaller distance from the current price (so that we profit from even the small oscillations); the other way would be to place the STOP orders at a greater distance from the current prices (so that the orders did not trigger at all until the price moved significantly up or down).
This final point goes to show that what is important is not only the choice of trading pattern, but also the values of the parameters — like stop distances and limit prices — that help shape the pattern when it is applied. It’s a point that I first made in this article on automated trading.
This article has been devised and adapted from original text and pictures included in the book “Financial Trading Patterns” by Tony Loton (with permission).

