Trading Trail #33: A Tale of Two Pyramids
Feb 10, 2012 at 9:03 pm in Trading Diary by
It’s time for another “trading trail” update, with a little educational piece that is related to the portfolio thrown in on the subject of pyramiding. I’ll update you on the portfolio performance first, then I’ll tell you the “tale of my two pyramids”.
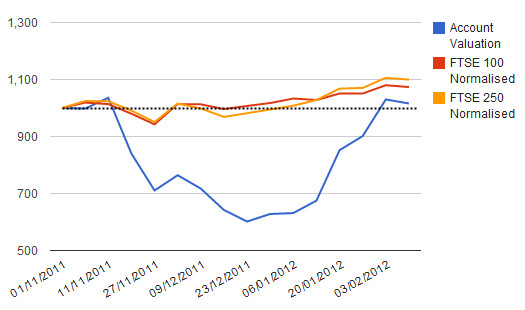
Since I last updated you about being back at break-even, the trading trail portfolio value has stayed above the water mark as shown below.

During the past week, the portfolio value actually peaked at about £1065, and although I didn’t catch this momentous occasion exactly, I did manage to capture the following snapshot as proof of the peak performance. As is often the case, things turned sour on the final trading day of the week, but I’m still above water and the last-day fall was not much faster than the FTSE indices.
![]()
The difference between now and when I last had a portfolio value of £1000+ (in November) is that now I have 47 positions in play with some of them being double-size pyramided or carefully averaged down positions. If the markets go south, I’ll have no need and will be in no rush to add yet more positions unless they are compelling. If the markets revert to heading higher then I expect my portfolio value to rise faster than the FTSE(s). Well, that’s the theory.
And now for the educational feature…
A Tale of Two Pyramids
One of the key ideas that is central to the position trading strategy I’m running in my “trading trail” reference account is the idea of pyramiding initially-small stakes into larger stakes as positions become more and more profitable. Profitability is the key, which is why I never establish a second pyramided position until the new risk is more than compensated by the profit locked in (via a stop order) on the original position.
I’ve not been able to do much pyramiding in this account so far, but the recent bull run did afford me the opportunity to pyramid two different equities with slightly different results. These equities were Heidelberger Druckmaschinen and TUI Travel. Let’s look at what happened to them.
Heidelberger Druckmaschinen Pyramid
I established an original £1-per-point position in Heidelberger Druckmaschinen on 15 December at a price of 1.29. I then pyramided a second £1-per-point position on 20 January at a price of 1.53 when the original position was showing a profit of about £22. The idea was that this profit more than covered the additional risk-to-stop that I was taking on. As a matter of technicality, on this particular stock each £1-per-point bet is like a £10-per-point bet
The second position initially went into profit but then unfortunately fell back in due course and stopped out at 1.51 on 09 February for a loss of £2 plus about 20p in rolling charges accrued while the position was in play. The original position subsequently stopped out on 10 February when the price fell back further to 1.40 for a profit of £11 minus about £3 for the guaranteed stop and the rolling charges to date.
The overall profit on this concluded pyramid (and to all intents and purposes “failed” pyramid) was just over £5. Not ideal, but I don’t mind making a fiver — and more importantly not losing any money — each time one of my pyramiding attempts fails.
TUI Travel Pyramid
So far, I’m enjoying more luck with my pyramiding attempt on TUI Travel.
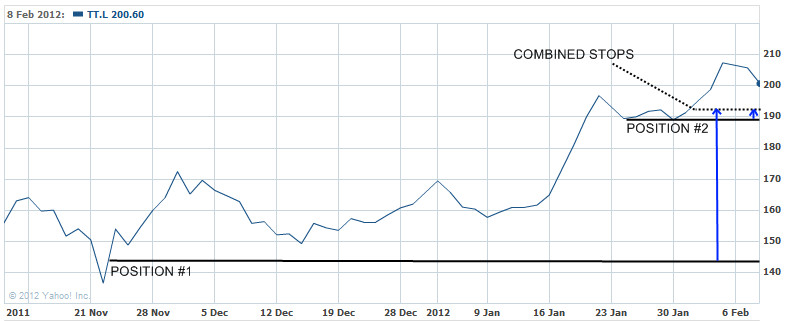
My initial £1-per-point position was established on 22 November at a price of 143.1, and it is currently guaranteed to stop out (if it does at all) at a price of 192.3 for a guaranteed profit of £49.20 minus about £3 for the guarantee and the rolling charges to date.
My second £1-per-point position was established on 24 January at a price of 189.7 and is currently guaranteed to stop out (if it does at all) at 192.3 for a guaranteed profit of £2.60 minus a similar amount for the guarantee and the rolling charges to date.
This pyramid has succeeded in the sense that it is still in play at a higher £2-per-point and the second position should stop out with a break-even result when the first position stops out with a healthy profit. Or, both positions may yet head higher.
For this example I’ll treat you to a chart (below) which shows the placement of both positions along with the placement of the common guaranteed stop order(s) that guarantee a profit on each position.

Have a good weekend, and happy trading!
Tony Loton is a private trader, and author of the book “Position Trading” (Second Edition) published by LOTONtech.

