Where Next for the FTSE 100?
Feb 11, 2015 at 12:46 am in General Trading by Provenance
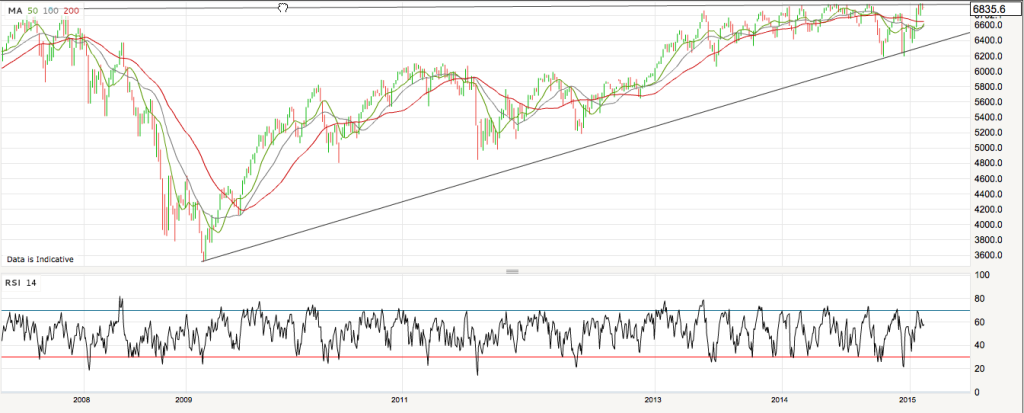
For the last two years the FTSE 100 has been relatively easy to trade. Stuck in a 900 or so point range, Britain’s index of leading companies has failed to make a new all-time high, despite at least nine attempts. Each assault on the peak has given way to failure and the smart money has cleaned up shorting this succession of false dawns. With the FTSE 100 at 6,835 last seen, will it be tenth time lucky or will we see another dramatic fall at the last hurdle?
At some point the FTSE 100 will surely have to break its 6950.6 record high, set in December 1999. From there it should be a quick jump to 7,000 and after that the sky’s the limit. Markets love big round numbers just as much as they love breaking long-standing records. As soon as that 7,000 mark is breached, it is a fair bet that fireworks will follow.
However, after such an extended period of failure to set a new high watermark, it is far from certain whether or not this time will be different. There are understandable doubts whether or not the FTSE 100 can join its global peers in the super-charged equity rally and make a series of new record highs.
Thankfully for traders this situation looks like a relatively straightforward one to play. With the prospect of a euphoric rally around the corner the upside potential is obvious. Equally, if the FTSE 100 fails at this level the disappointment can be easily quantified, based on all those pullbacks in the last few years.
The FTSE 100 is a market where it doesn’t matter whether or not you are long or short. Either way, it is possible to manage stops tightly and, if proved wrong in choice of direction, simply to switch from long to short or vice versa. That is the beauty of this trade.
At this point I probably should stop writing, but what sort of commentator would I be if I didn’t nail my colours to a mast?
I saw a piece by the MoneyWeek Trader, John Burford, yesterday in which he identified a ‘doozy’ of an ascending wedge pattern on the FTSE100. I’ve replicated the chart below;
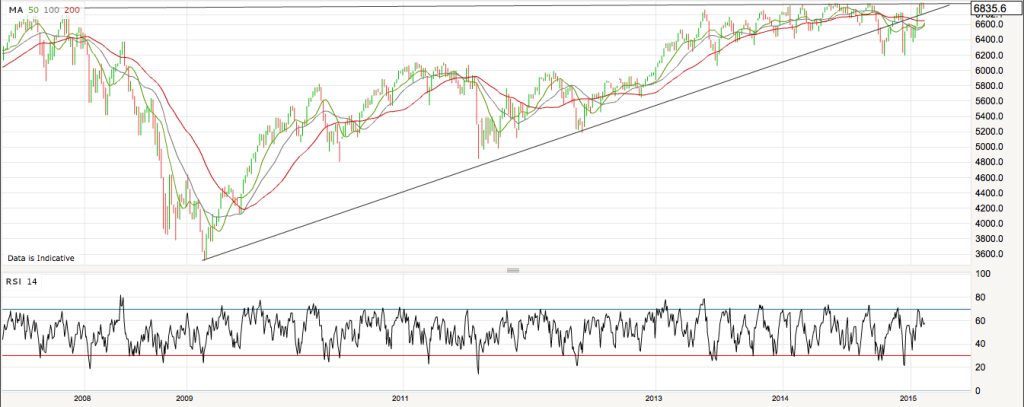
To be honest this wedge is fairly easy to spot. Its appeal is compelling. But there is slightly more to it than Burford suggests. Below is an alternative interpretation of broadly the same wedge, which broke in last October’s sell-off;
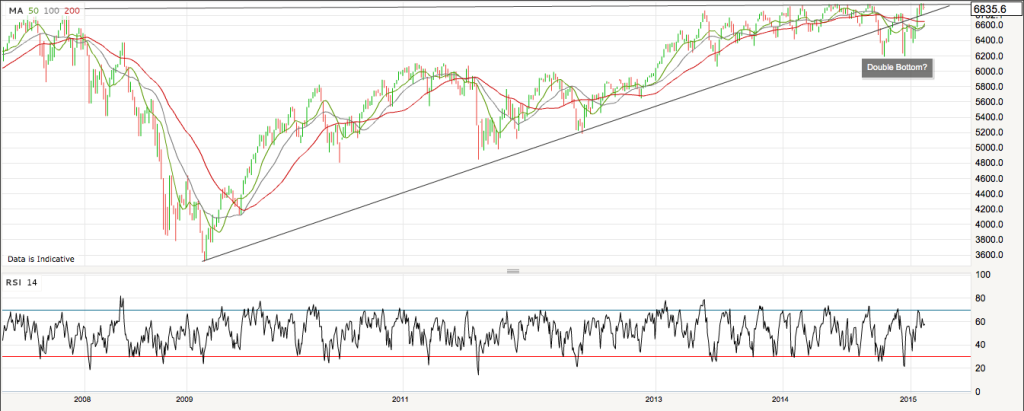
The point about this is that even though the wedge broke last October, the market ‘only’ fell about 400 hundred points; hardly the cataclysm Burford envisages. Although this would have been a profitable trade for anyone short, I’ve added to the chart below what looks like a fairly clear double bottom, after October’s broken wedge;
If this double bottom is confirmed (via a breakout in the FTSE 100 through long standing resistance) it could act as a firm foundation for a wild rally beyond 7,000.
Equally, though, Burford’s assessment could be on the money and if his wedge breaks, this could be the occasion that sees the FTSE 100 collapse.
For what it’s worth, I am more inclined towards the short side of this trade. There are plenty of reasons to want to short stocks at the moment from the worsening macro outlook to fears over the withdrawal of US Quantitative Easing. Add to this slowing Chinese growth, a possible “Grexit” from the euro and continued fighting in Ukraine and it is clear that headwinds are mounting.
But then again, different variations of these headwinds have featured strongly since 2008 and so far none has led to a significant bear market in equities. As much as I am drawn to the repeated failure of the FTSE100 to break into its Promised Land as a reason to short, I am not so wedded to this trade that if it becomes clear I am wrong I won’t switch direction.
IMPORTANT: The posts I make are in no way meant as investment suggestions or recommendations to any visitors to the site. They are simply my views, personal reflections and analysis on the markets. Anyone who wishes to spread bet or buy stocks should rely on their own due diligence and common sense before placing any spread trade


