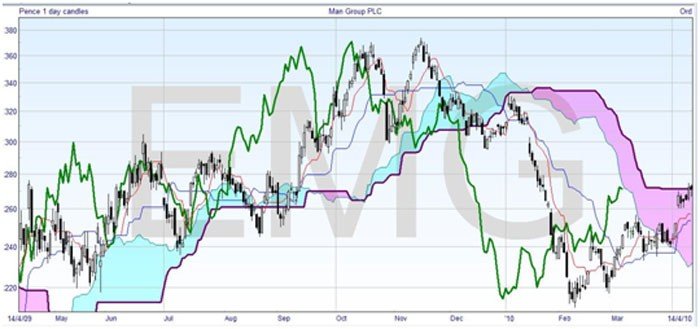
Now we come to the fifth line on the cloud chart, and perhaps the simplest. It’s just the closing price line shifted backwards by 26 days or periods. Note that the cloud is shifted forwards by 26, and the lagging line is shifted backwards, or lags, by 26. This line is used a lot in cloud charts for confirmations. Just to point it out on this chart, I’ve thickened up the green line.
You can easily see that it echoes the movement of the prices, but is placed before them. The way it is constructed means there is a total of 52 days or periods between the cloud and the Lagging Line.
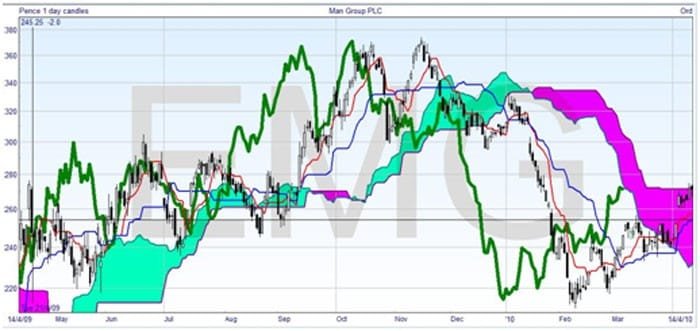
When you start using cloud charts it’s worth taking some time to set the colors and thicknesses so that they are clear to you. Some people take the candlesticks off the charts altogether, but as they can give you valuable information I don’t recommend this. The principal lines to emphasize are the Leading Span B and the Lagging Line, so I suggest you make these thicker. Here’s the above chart modified to look a little more reasonable –