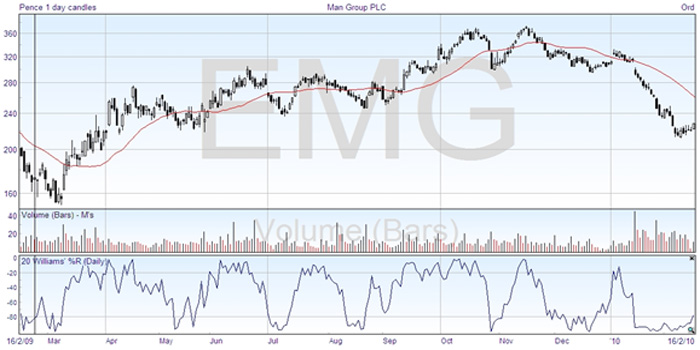
The Williams oscillator is based on a similar idea, taking account of the position of the price close in relation to the price range over a certain number of days. It is shown below for 20 days. In practice the close is subtracted from the price high for the last 20 days, and then divided by the total range over the last 20 days. When it is plotted, the software turns it upside down (because the price is subtracted from the high) so that it goes in the same direction as other indicators.
The concept for using it is the same as other oscillators, looking for divergences from the price action when the line is in the over extended areas. You can see below that the Williams %R is more volatile than the stochastic above. This is to be expected, as the slow stochastic has three day smoothing by moving average applied to it.