
Now this is where it starts getting interesting, and a little different from the other things you’ve learned about technical analysis. The trick to the cloud chart is that lines are drawn but then shifted in time, as you’ll see.
Leading Span A is drawn by taking the midpoint between the Turning Line and the Standard Line, and then shifting it forward by 26 periods. Here I’ve drawn it in turquoise and thicker, and you can see by eye how it is the midpoint between the other two lines moved to the right –

The second cloud line, the Leading Span B, doesn’t use the first two lines, but is similar in that it is shifted to the right by 26 periods. It uses the highest high and the lowest low for the last 52 periods, then takes the midpoint just as the first two lines did — but then it’s shifted forward 26 periods. Here is how that turns out –

I’ve thickened it up again, and this time it’s in purple — I’m just using the default colors on the ShareScope software. As it’s starting to look little more complicated, I’ll just sum up what we’ve done.
Think of the technique of taking the middle value between the highest high and the lowest low as similar to taking the moving average — as we saw above, both methods give a similar sort of shaped line.
We started with the Turning Line, the red one, which is like a nine day moving average. We added the Standard Line, the blue one, which is like a 26 day moving average. The Leading Span A, as it averages these two lines, is like a 17 1/2 day moving average, and the Leading Span B is like a 52 day moving average, but both of these are shifted forward 26 days. So when Leading Span A is above B, the shorter-term is above the longer-term and it’s a bullish sign — but shown in the future.
Note that the cloud between these leading span lines is normally colored, or at least hatched, and the color of the cloud tells you whether the prices are rising or falling. For this chart, I’ve stuck with the standard turquoise and purple that ShareScope offers, but I have darkened them up for emphasis. The turquoise cloud is bullish and the purple cloud is in a downtrend.
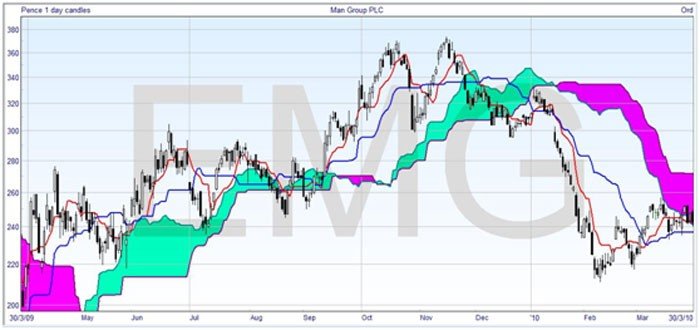
So the bullish cloud from November to January is a reflection of the bullish market over a month before. We’ll come to it later on, but even though I’m talking about and showing days on this chart it’s just for ease of reference — cloud charts can be drawn for any time scale, as with most technical analysis, and I’m really talking about the number of candlesticks.